

Question: Using the data from your Week 3 Mean Median, and Mode assignment, demonstrate in graphic form the variability of the 2 examples. x C Get
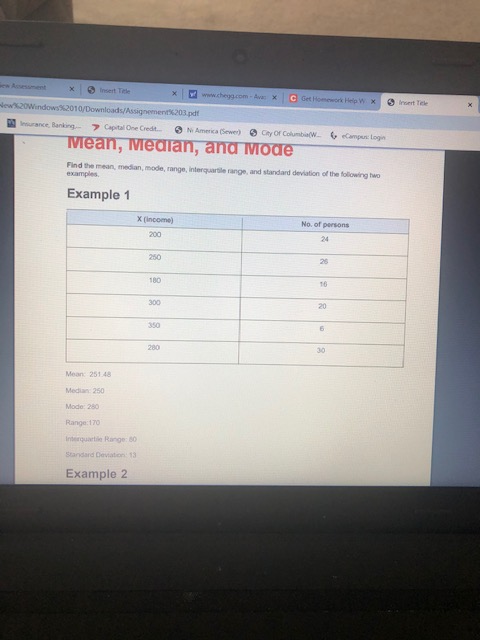
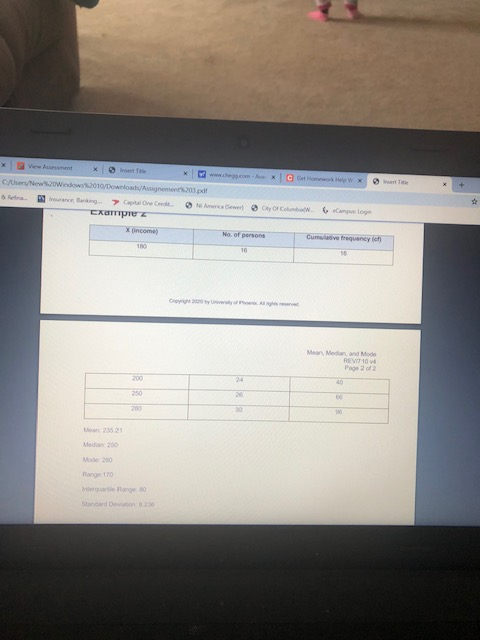
Using the data from your Week 3 Mean Median, and Mode assignment, demonstrate in graphic form the variability of the 2 examples.
Step by Step Solution
There are 3 Steps involved in it
1 Expert Approved Answer
Step: 1 Unlock

Question Has Been Solved by an Expert!
Get step-by-step solutions from verified subject matter experts
Step: 2 Unlock
Step: 3 Unlock