

Question: Using the data in the Control Charts spreadsheet, create* an appropriate chart for the data at the problems tabs. Use software or do it by
Using the data in the Control Charts spreadsheet, create* an appropriate chart for the data at the problems tabs. Use software or do it by hand. Plot the data* that was used to create the chart on the chart. Be sure to provide USL, LSL, UCL, LCL, and Cp or Cpk as needed.
X-bar chart: find an x-bar and range chart (XbarR)
Moving x-bar: find and moving x-bar and moving range chart (XmR)
p chart: find either a proportion chart, a percent chart. Create only one chart but supply the central line and control limits for the other two types. The chart would look the same for all three, but the central line and control limits would be labeled differently.
np chart: find a non-conforming per units, np chart. It may be a continuation or extension of the previous p chart.
c chart: find a count, c chart.
u chart: find a non-conforming in units, u chart.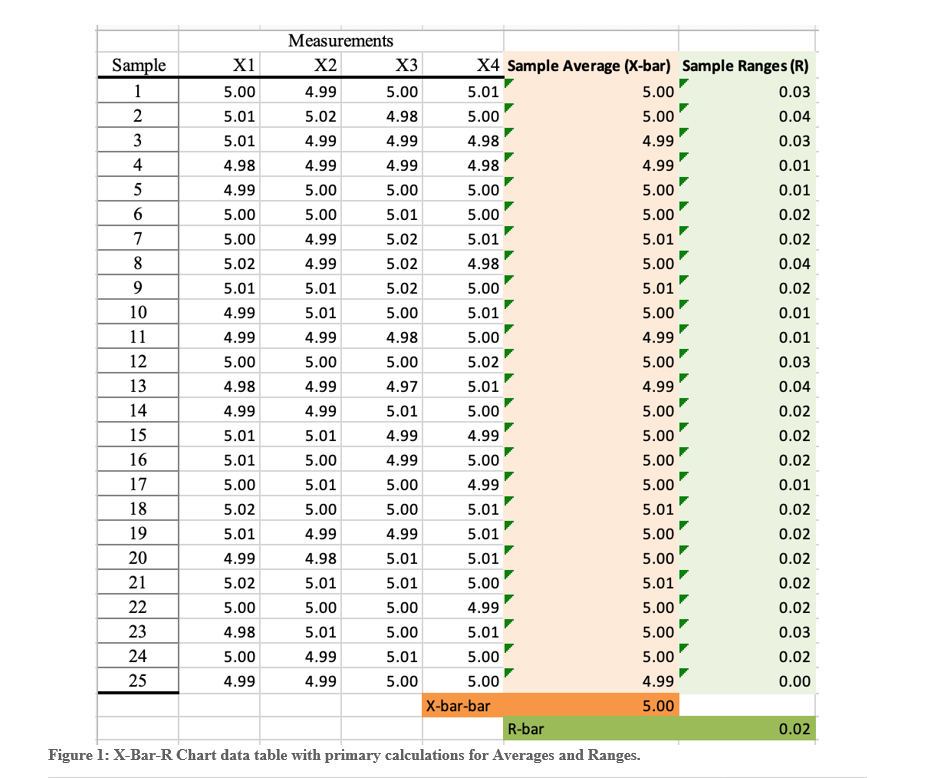
Figure 1: X-Bar-R Chart data table with primary calculations for Averages and Ranges
Step by Step Solution
There are 3 Steps involved in it

Get step-by-step solutions from verified subject matter experts