

Question: Using the data in the following table, and the fact that the correlation of A and B is 0.48, calculate the volatility (standard deviation) of
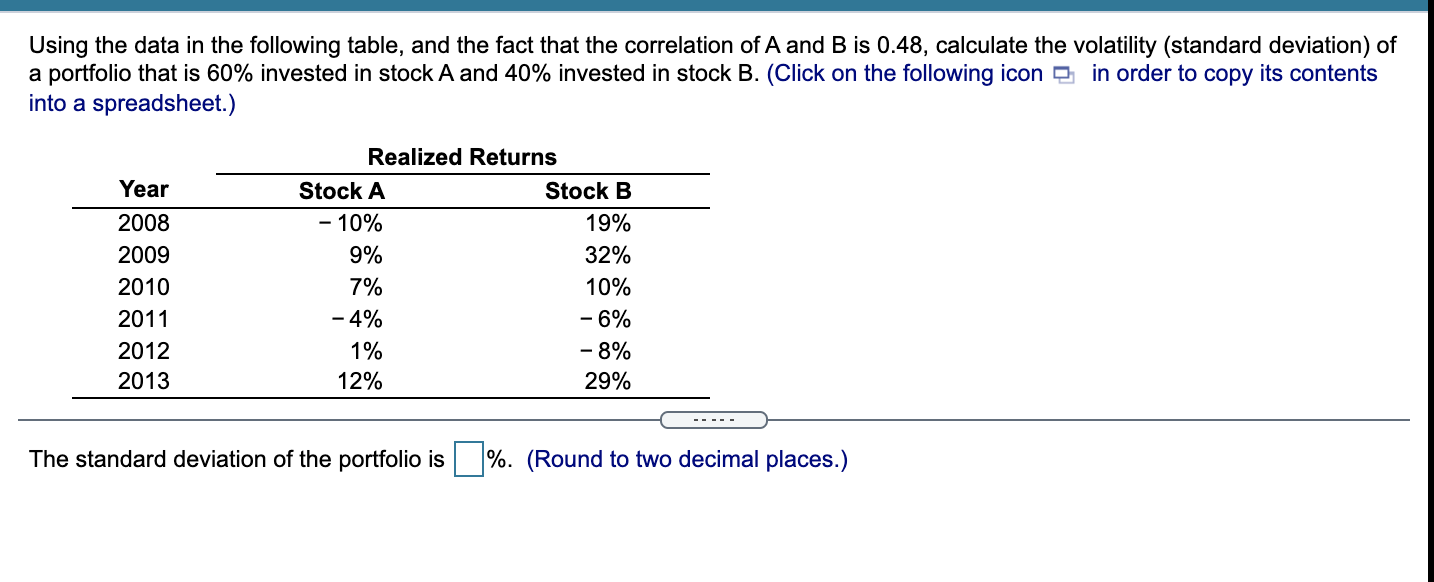
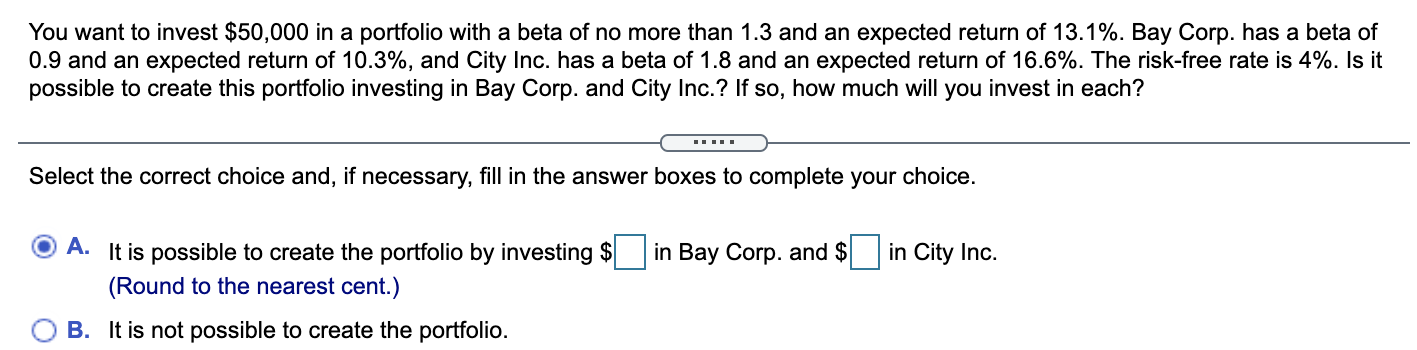
Using the data in the following table, and the fact that the correlation of A and B is 0.48, calculate the volatility (standard deviation) of a portfolio that is 60% invested in stock A and 40% invested in stock B. (Click on the following icon in order to copy its contents into a spreadsheet.) Year 2008 2009 2010 2011 2012 2013 Realized Returns Stock A Stock B - 10% 19% 9% 32% 7% 10% -4% -6% 1% -8% 12% 29% The standard deviation of the portfolio is \%. (Round to two decimal places.) You want to invest $50,000 in a portfolio with a beta of no more than 1.3 and an expected return of 13.1%. Bay Corp. has a beta of 0.9 and an expected return of 10.3%, and City Inc. has a beta of 1.8 and an expected return of 16.6%. The risk-free rate is 4%. Is it possible to create this portfolio investing in Bay Corp. and City Inc.? If so, how much will you invest in each? Select the correct choice and, if necessary, fill in the answer boxes to complete your choice. A. It is possible to create the portfolio by investing $ in Bay Corp. and $ in City Inc. (Round to the nearest cent.) B. It is not possible to create the portfolio
Step by Step Solution
There are 3 Steps involved in it

Get step-by-step solutions from verified subject matter experts