

Question: Using the data in the following table, estimate (a) the average return and volatility for each stock; (b) the covariance between the stocks and (c)
Using the data in the following table, estimate (a) the average return and volatility for each stock; (b) the covariance between the stocks and (c) the correlation between these two stocks
Need help with part b and c. Posted this question once and was given the wrong answer.
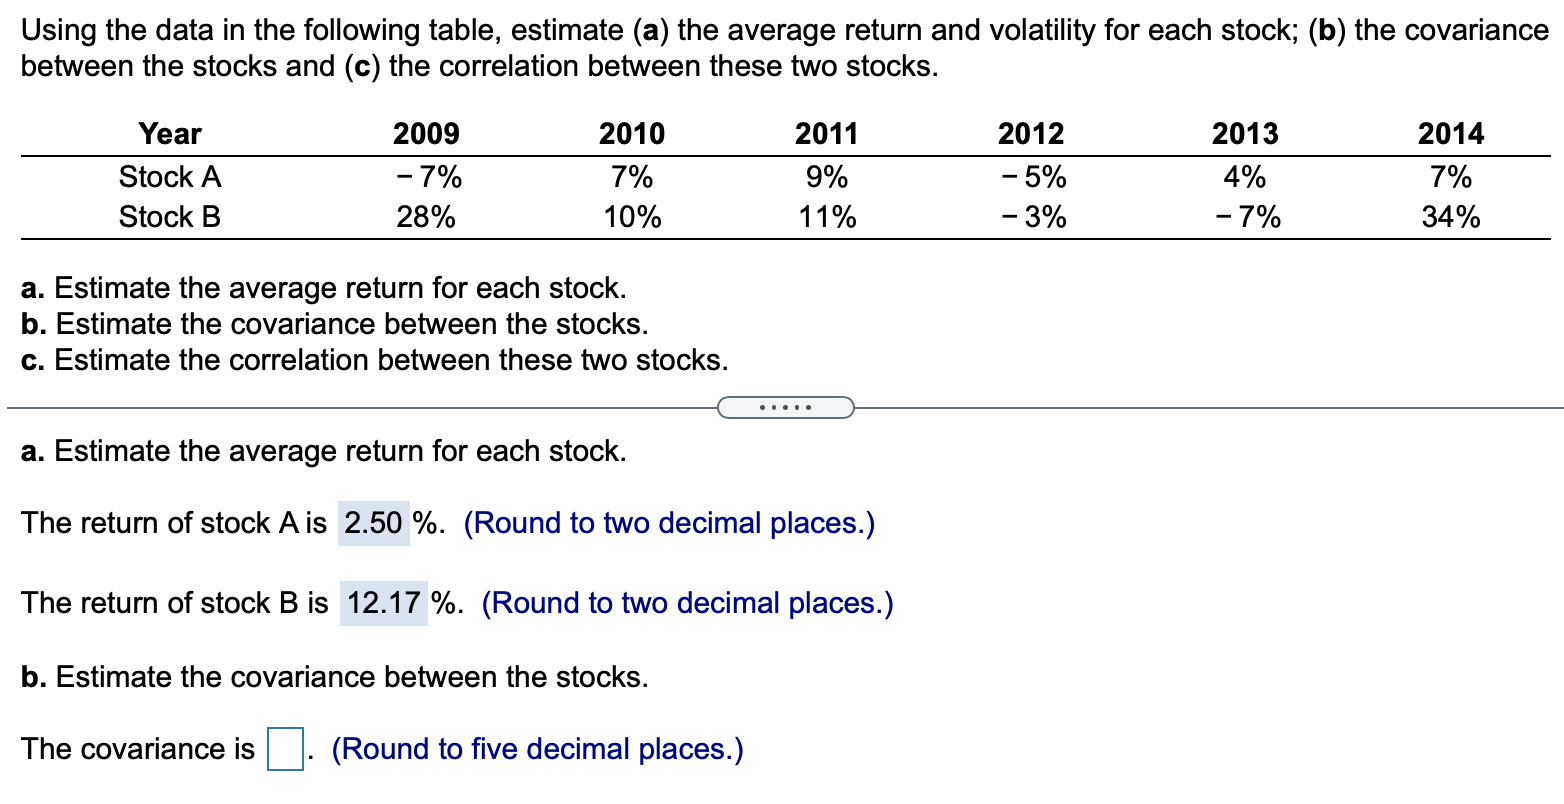
Using the data in the following table, estimate (a) the average return and volatility for each stock; (b) the covariance between the stocks and (c) the correlation between these two stocks. Year Stock A Stock B 2009 -7% 28% 2010 7% 10% 2011 9% 11% 2012 -5% -3% 2013 4% -7% 2014 7% 34% a. Estimate the average return for each stock. b. Estimate the covariance between the stocks. c. Estimate the correlation between these two stocks. a. Estimate the average return for each stock. The return of stock A is 2.50 %. (Round to two decimal places.) The return of stock B is 12.17 %. (Round to two decimal places.) b. Estimate the covariance between the stocks. The covariance is (Round to five decimal places.)
Step by Step Solution
There are 3 Steps involved in it

Get step-by-step solutions from verified subject matter experts