

Question: Using the data in the following table, estimate the average return and volatility for each stock. (Click on the following icon begin{tabular}{crr} & multicolumn{2}{c}{ Realized
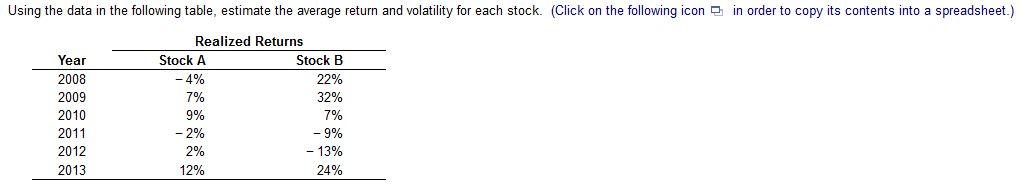
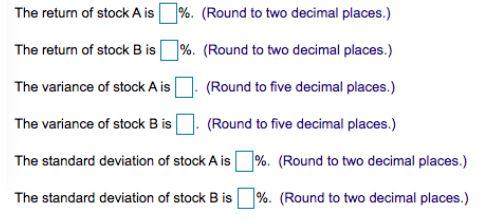
Using the data in the following table, estimate the average return and volatility for each stock. (Click on the following icon \begin{tabular}{crr} & \multicolumn{2}{c}{ Realized Returns } \\ \cline { 2 - 3 } Year & Stock A & Stock B \\ \hline 2008 & 4% & 22% \\ 2009 & 7% & 32% \\ 2010 & 9% & 7% \\ 2011 & 2% & 9% \\ 2012 & 2% & 13% \\ 2013 & 12% & 24% \\ \hline \end{tabular} The return of stockA is \%. (Round to two decimal places.) The return of stock B is %. (Round to two decimal places.) The variance of stock A is . (Round to five decimal places.) The variance of stock B is. (Round to five decimal places.) The standard deviation of stock A is \%. (Round to two decimal places.) The standard deviation of stock B is \%. (Round to two decimal places.)
Step by Step Solution
There are 3 Steps involved in it

Get step-by-step solutions from verified subject matter experts