

Question: Using the data in the following table, estimate the average return and volatility for each stock. begin{tabular}{crr} & multicolumn{2}{c}{ Realized Returns } cline {
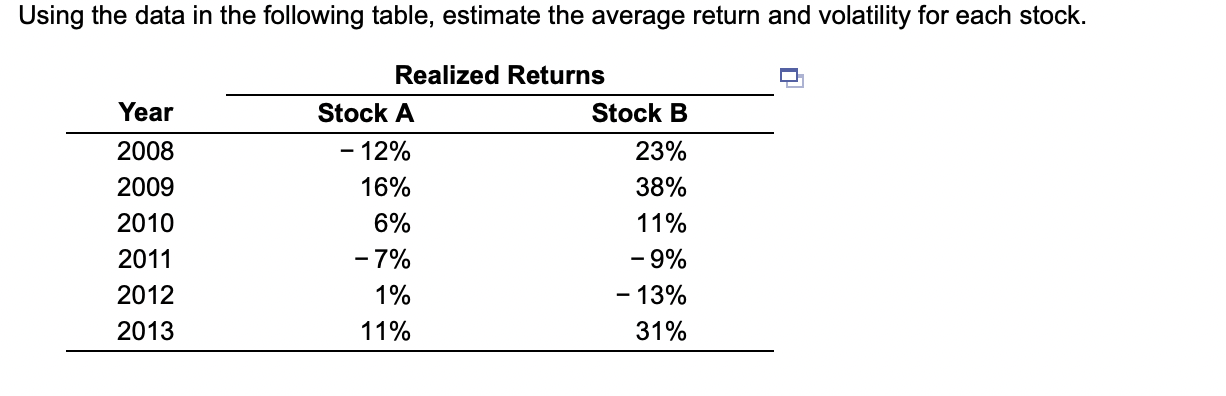
Using the data in the following table, estimate the average return and volatility for each stock. \begin{tabular}{crr} & \multicolumn{2}{c}{ Realized Returns } \\ \cline { 2 - 3 } Year & Stock A & Stock B \\ \hline 2008 & 12% & 23% \\ 2009 & 16% & 38% \\ 2010 & 6% & 11% \\ 2011 & 7% & 9% \\ 2012 & 1% & 13% \\ 2013 & 11% & 31% \\ \hline \end{tabular}
Step by Step Solution
There are 3 Steps involved in it
1 Expert Approved Answer
Step: 1 Unlock

Question Has Been Solved by an Expert!
Get step-by-step solutions from verified subject matter experts
Step: 2 Unlock
Step: 3 Unlock