

Question: Using the data in the following table, Year Stock A Stock B 2004 - 1095 2005 20% 2006 596 7% 2007 1096 -1096 2008 596
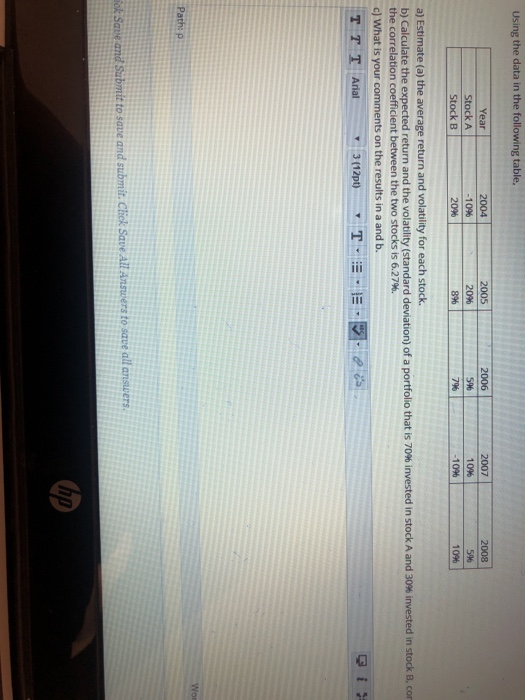
Using the data in the following table, Year Stock A Stock B 2004 - 1095 2005 20% 2006 596 7% 2007 1096 -1096 2008 596 10% 20% 896 a) Estimate (a) the average return and volatility for each stock. b) Calculate the expected return and the volatility (standard deviation) of a portfolio that is 70% invested in stock A and 30% invested in stock B, cor the correlation coefficient between the two stocks is 6.27%. c) What is your comments on the results in a and b. TT T Arial 3 (12pt) T Wor Pathop ick Save and Submit to save and submit. Click Save All Answers to save all answers. hp
Step by Step Solution
There are 3 Steps involved in it
1 Expert Approved Answer
Step: 1 Unlock

Question Has Been Solved by an Expert!
Get step-by-step solutions from verified subject matter experts
Step: 2 Unlock
Step: 3 Unlock