

Question: Using the data in the picture A. Compute the average return for each of the assets from 1929 to 1940 (the Great Depression) B. Compute
Using the data in the picture
A. Compute the average return for each of the assets from 1929 to 1940 (the Great Depression)
B. Compute the Variance and standard deviation for each of the assets from 1920 to 1940.
C. Which ass that was the riskiest during the Great Depression? How does that fit with your intuition?
Note: Notice that the answers for average return, variance and standard deviation must be entered in decimal format.
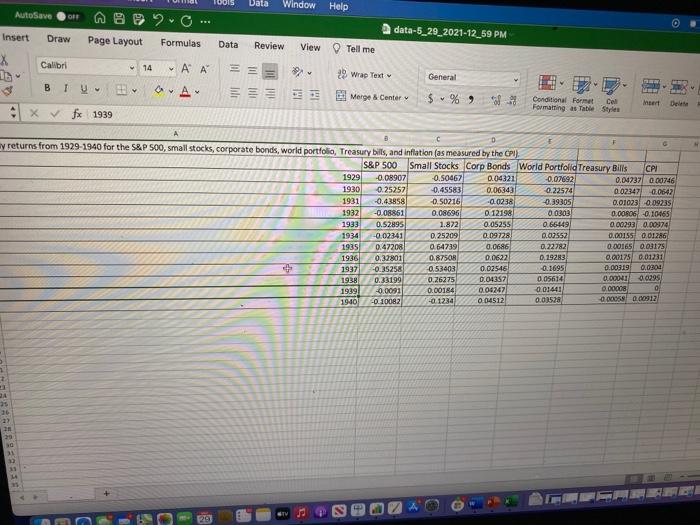
Data Window Help AutoSave data-5_29_2021-12_59 PM Insert Draw Page Layout Formulas Data Review View Tell me X Calibri 14 ' General B TV A 29 Wrap Text Merge & Center = = = $% * Conditional Format Cell Formatting as Table Styles Insert Delete Xfx 1939 ay returns from 1929-1940 for the S&P 500, small stocks, corporate bonds, world portfolio, Treasury bills, and inflation (as measured by the CPU S&P 500 Small Stocks Corp Bonds World Portfolid Treasury Bills CPI 1929 -0.08907 -0.50467 0.04321 -0.07692 0.01737/ 000746 1930 0.25257 -0.45583 0.06343 0.22574 0.02.347 0.0642 1931 -0.43858 -0.50216 -0.0238 -0.39305 0.010230 09235 1932 -0.08851 0.08696 0.12198 0.0303 0.00806 -0.10465 1933 0.52895 1.872 0.05255 0.66649 0.00293 0.00374 1934 -0.02341 0.25209 0.09728 0.02552 0.00155 0.01286 1935 0.47208 0.64739 0.0686 0.22782 0.00165 0.03175 1936 0.32801 0.8750R 0.0622 0,19283 0.00175 0.01231 + 1937 -0.35258 0.53403 0.02546 0.1695 0.00319 0.0200 1938 0.33199 0.26275 0.01357 0.05614 0.00011 0.0295 1991 -0.0091 0.00184 0.04247) 0.01441 0.00008 0 1940 -0.100R2 -0.123 0.04512 0.03528 0.00058 000912 1 2 3 M 129
Step by Step Solution
There are 3 Steps involved in it

Get step-by-step solutions from verified subject matter experts