

Question: Complete the steps below using cell references to given data or previous calculations. In some cases, a simple cell reference is all you need. To
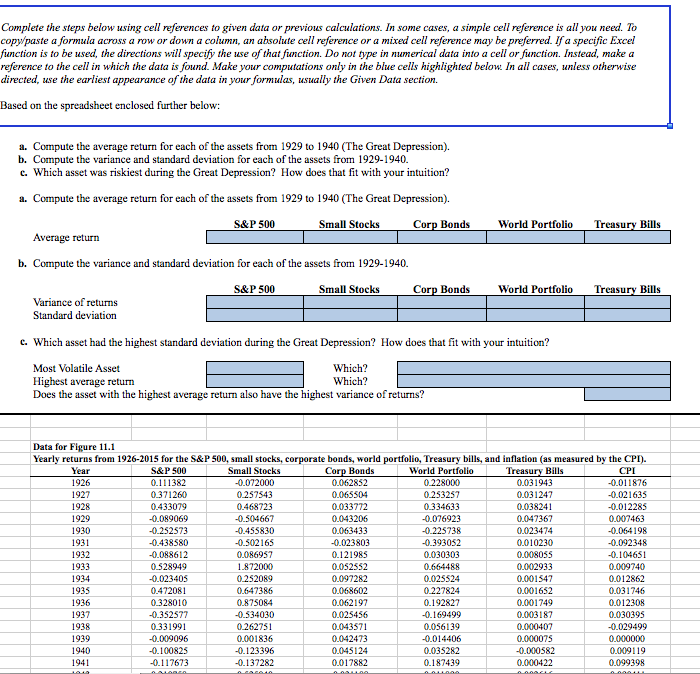
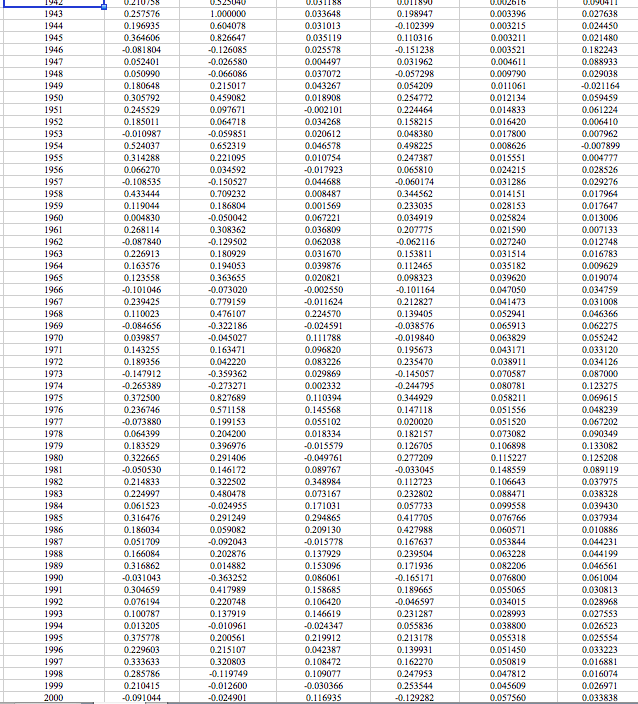
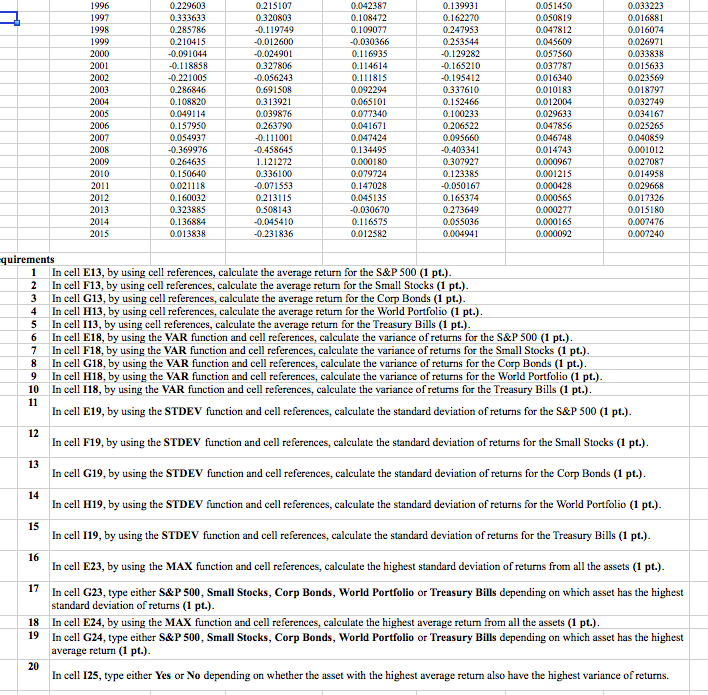
Complete the steps below using cell references to given data or previous calculations. In some cases, a simple cell reference is all you need. To copy paste a formula across a row or down a column, an absolute cell reference or a mixed cell reference may be preferred. If a specific Excel function is to be used, the directions will specify the use of that function. Do not type in numerical data into a cell or function. Instead, make a reference to the cell in which the data is found. Make your computations only in the blue cells highlighted below. In all cases, unless otherwise directed, use the earliest appearance of the data in your formulas, usually the Given Data section. Based on the spreadsheet enclosed further below: a. Compute the average return for each of the assets from 1929 to 1940 (The Great Depression). b. Compute the variance and standard deviation for each of the assets from 1929-1940. c. Which asset was riskiest during the Great Depression? How does that fit with your intuition? a. Compute the average return for each of the assets from 1929 to 1940 (The Great Depression). S&P 500 Small Stocks Corp Bonds World Portfolio Treasury Bills Average return b. Compute the variance and standard deviation for each of the assets from 1929-1940. S&P 500 Small Stocks Corp Bonds World Portfolio Treasury Bills Variance of returns Standard deviation c. Which asset had the highest standard deviation during the Great Depression? How does that fit with your intuition? Most Volatile Asset Which? Highest average return Which? Does the asset with the highest average return also have the highest variance of returns? Data for Figure 11.1 Yearly returns from 1926-2015 for the S&P 500, small stocks, corporate bonds, world portfolio, Treasury bills, and inflation (as measured by the CPI). Year S&P 500 Small Stocks Corp Bonds World Portfolio Treasury Bills 1926 0.111382 -0.072000 0.062852 0.228000 0.031943 -0.011876 1927 0.371260 0.257543 0.065504 0.253257 0.031247 -0.021635 1928 0.433079 0.468723 0.033772 0.334633 0.038241 -0.012285 1929 -0.089069 -0.504667 0.043206 -0.076923 0.047367 0.007463 1930 -0.252573 -0.455830 0.063433 -0.225738 0.023474 -0.064198 1931 -0.438580 -0.502165 -0.023803 -0.393052 0.010230 -0.092348 1932 -0.088612 0.086957 0.121985 0.030303 0.00805S -0.104651 1933 0.528949 1.872000 0.052552 0.664488 0.002933 0.009740 1934 -0.023405 0.252089 0.097282 0.025524 0.001547 0.012862 1935 0.472081 0.647386 0.068602 0.227824 0.001652 0.031746 0.328010 0.875084 0.062197 0.192827 0.001749 0.012308 1937 -0.352577 -0.534030 0.025456 -0.169499 0.003187 0.030395 1938 0.331991 0.262751 0.043571 0.056139 0.000407 -0.029499 1939 -0.009096 0.001836 0.042473 -0.014406 0.000075 0.000000 1940 -0.100825 -0.123396 0.045124 0.035282 -0.000582 0.009119 1941 -0.117673 -0.137282 0.017882 0.187439 0.000422 0.099398 1936 1943 1944 1945 1946 1947 1948 1949 1950 1951 1952 1953 1954 1955 1956 1957 1958 1959 1960 1961 1962 1963 1964 1965 1967 1968 1969 1970 1971 1972 1973 1974 1975 1976 1977 1978 1979 1980 1981 1982 0.257576 0.196935 0.364606 -0.081804 0.052401 0.030990 0.180648 0.305792 0.245529 0.18S011 -0.010987 0.524037 0.314288 0.066270 -0.108535 0.433444 0.119044 0.004830 0.268114 -0.087840 0.226913 0.163576 0.123558 -0.101046 0.239425 0.110023 -0.084656 0.039857 0.143255 0.189356 -0.147912 -0.265389 0.372500 0.236746 -0.073880 0.064399 0.183529 0.322665 -0.0S0S30 0214833 0224997 0.061523 0.316476 0.186034 0.051709 0.166084 0.316862 -0.031043 0.304659 0.076194 0.100787 0013205 0.375778 0229603 0.333633 0.285786 0.210415 -0.091044 UA040 1.000000 0.604078 0.826647 -0.126085 -0.026580 -0.066086 0.215017 0.459082 0.097671 0.064718 -0.059851 0.652319 0.221095 0.034592 -0.150527 0.709232 0.186804 -0.050042 0.308362 -0.129 502 0.180929 0.194053 0.363655 -0.073020 0.779159 0.476107 -0.322186 -0.045027 0.163471 0.042220 -0.359362 -0.273271 0.827689 0.571158 0.199153 0.2044200 0.396976 0.291406 0.146172 0.322502 0.480478 -0.024955 0.291249 0.059082 -0.092043 0.202876 0.014882 -0.363252 0.417989 0.220748 0.137919 -0.010961 0.200561 0.215107 0.320803 -0.119749 -0.012600 -0.024901 0.033648 0.031013 0.035119 0.025578 0.004497 0.032072 0.043267 0.018908 -0.002101 0.034268 0.020612 0.046978 0.010754 -0.012923 0.044688 0.008487 0.001569 0.062221 0.036809 0.062038 0.031670 0.039876 0.020821 -0.002550 -0.011624 0.224570 -0.024591 0.111788 0.096820 0.083226 0.029869 0.002332 0.110394 0.145568 0.0SS102 0.018334 -0.015579 -0.049761 0.089767 0.348984 0.073167 0.171031 0.294865 0.209130 -0.015278 0.137929 0.153096 0.086061 0.158685 0.106420 0.146619 -0.024347 0219912 0.042387 0.108472 0.109077 -0.030366 0.116935 0.198947 -0.102399 0.110316 -0.151238 0.031962 -0.057298 0.054209 0.254772 0.224464 0.158215 0.048380 0.498225 0.247387 0.065810 -0.060174 0.344562 0.233035 0.034919 0.207775 -0.062116 0.153811 0.112465 0.098323 -0.101164 0.212827 0.139405 -0.038576 -0.019840 0.195673 0.235470 -0.145057 -0.244795 0.344929 0.142118 0.020020 0.182157 0.126705 0.277209 -0.033045 0.112723 0.232802 0.057733 0.417705 0.422988 0.167637 0.239504 0.171936 -0.16171 0.189665 -0.046597 0.231287 0.055836 0.213178 0.139931 0.162270 0.247953 0.253544 -0.129282 II 2016 0.003396 0.003215 0.003211 0.003521 0.004611 0.009790 0.011061 0.012134 0.014833 0.016420 0.017800 0.008626 0.015551 0.024215 0.031286 0.014151 0.028153 0.025824 0.021590 0.027240 0.031514 0.035182 0.039620 0.047050 0.041473 0.052941 0.065913 0.063829 0.043171 0.038911 0.070587 0.080781 0.058211 0.051556 0.051520 0.073082 0.106898 0.115227 0.148559 0.106643 0.088471 0.099558 0.076766 0.060571 0.053844 0.063228 0.082206 0.076800 0.055065 0.034015 0.028993 0.038800 0.055318 0.0S1450 0.050819 0.047812 0.045609 0.057560 UYU411 0.027638 0.024450 0.021480 0.182243 0.088933 0.02903 -0.021164 0.059459 0.061224 0.006410 0.007962 -0.002899 0.004777 0.028526 0.029276 0.017964 0.017647 0.013006 0.007133 0.012748 0.016783 0.009629 0.019074 0.034750 0.031008 0.046366 0.062275 0.055242 0.033120 0.034126 0.087000 0.123275 0.069615 0.048229 0.067202 0.090349 0.133082 0.125208 0.089119 0.037975 0.039328 0.039430 0.037934 0.010886 0.044231 0.044100 0.046561 0.061004 0.030813 0.028968 0.027553 0.026523 0.025554 0.033223 0.016881 0.016074 0.026971 0.033838 1983 1984 1985 1986 1987 1988 1989 1990 1991 1992 1993 1994 1995 1996 1997 1998 1999 2000 1996 1997 1998 1999 2000 2001 2002 2003 2004 2005 2006 2007 2008 2009 2010 2011 2012 2013 2014 2015 0.229603 0333633 0.285786 0.210415 -0.091044 -0.118858 -0.221005 0.286846 0.108820 0.049114 0.157950 0.054937 -0.369976 0.264635 0.150640 0.021118 0.160032 0.323885 0.136884 0.013838 0.215107 0.320803 -0.119749 -0.012600 -0.024901 0.327806 -0.056243 0.691508 0.313921 0.039876 0.263790 -0.111001 -0.458645 1.121272 0.336100 -0.071553 0.213115 0508143 -0.045410 -0.231836 0.042387 0.108472 0.109077 -0.030366 0.116935 0.114614 0.111815 0.092294 0.065101 0.077340 0.041671 0.047424 0.134495 0.000180 0.079724 0.147028 0.045135 -0.030670 0.116575 0.012582 0.139931 0.162270 0.247953 0.253544 -0.129282 -0.165210 -0.195412 0.337610 0.152466 0.100233 0.206522 0.095660 -0.403341 0.307927 0.123385 -0.050167 0.165374 0.273649 0.055036 0.004941 0.051450 0.050819 0.047812 0.045609 0.057560 0.032787 0.016340 0.010183 0.012004 0.029633 0.047856 0.046748 0.014743 0.000967 0.001215 0.000428 0.000565 0.000277 0.000165 0.000092 0.033223 0.016881 0.016074 0.026971 0.033838 0.015633 0.023569 0.018797 0.032749 0.034167 0.025265 0.040859 0.001012 0.027087 0.014958 0.029668 0.017326 0.015180 0.007476 0.007240 quirements 1 In cell E13, by using cell references, calculate the average return for the S&P 500 (1 pt.). 2 In cell F13, by using cell references, calculate the average return for the Small Stocks (1 pt.). 3 In cell G13, by using cell references, calculate the average return for the Corp Bonds (1 pt.). 4 In cell H13, by using cell references, calculate the average return for the World Portfolio (1 pt.). 5 In cell 113, by using cell references, calculate the average return for the Treasury Bills (1 pt.). 6 In cell E18, by using the VAR function and cell references, calculate the variance of returns for the S&P 500 (1 pt.). 7 In cell F18, by using the VAR function and cell references, calculate the variance of returns for the Small Stocks (1 pt.). 8 In cell G18, by using the VAR function and cell references, calculate the variance of returns for the Corp Bonds (1 pt.). 9 In cell H18, by using the VAR function and cell references, calculate the variance of returns for the World Portfolio (1 pt.). 10 In cell 118, by using the VAR function and cell references, calculate the variance of returns for the Treasury Bills (1 pt.). 11 In cell E19, by using the STDEV function and cell references, calculate the standard deviation of returns for the S&P 500 (1 pt.). In cell F19, by using the STDEV function and cell references, calculate the standard deviation of returns for the Small Stocks (1 pt.). In cell G19, by using the STDEV function and cell references, calculate the standard deviation of returns for the Corp Bonds (1 pt.). In cell H19, by using the STDEV function and cell references, calculate the standard deviation of returns for the World Portfolio (1 pt.). In cell 119, by using the STDEV function and cell references, calculate the standard deviation of returns for the Treasury Bills (1 pt.). In cell E23, by using the MAX function and cell references, calculate the highest standard deviation of returns from all the assets (1 pt.). 18 In cell G23, type either S&P 500, Small Stocks, Corp Bonds, World Portfolio or Treasury Bills depending on which asset has the highest standard deviation of returns (1 pt.). In cell E24, by using the MAX function and cell references, calculate the highest average return from all the assets (1 pt.). In cell G24, type either S&P 500, Small Stocks, Corp Bonds, World Portfolio or Treasury Bills depending on which asset has the highest average return (1 pt.). In cell 125, type either Yes or No depending on whether the asset with the highest average return also have the highest variance of returns. Complete the steps below using cell references to given data or previous calculations. In some cases, a simple cell reference is all you need. To copy paste a formula across a row or down a column, an absolute cell reference or a mixed cell reference may be preferred. If a specific Excel function is to be used, the directions will specify the use of that function. Do not type in numerical data into a cell or function. Instead, make a reference to the cell in which the data is found. Make your computations only in the blue cells highlighted below. In all cases, unless otherwise directed, use the earliest appearance of the data in your formulas, usually the Given Data section. Based on the spreadsheet enclosed further below: a. Compute the average return for each of the assets from 1929 to 1940 (The Great Depression). b. Compute the variance and standard deviation for each of the assets from 1929-1940. c. Which asset was riskiest during the Great Depression? How does that fit with your intuition? a. Compute the average return for each of the assets from 1929 to 1940 (The Great Depression). S&P 500 Small Stocks Corp Bonds World Portfolio Treasury Bills Average return b. Compute the variance and standard deviation for each of the assets from 1929-1940. S&P 500 Small Stocks Corp Bonds World Portfolio Treasury Bills Variance of returns Standard deviation c. Which asset had the highest standard deviation during the Great Depression? How does that fit with your intuition? Most Volatile Asset Which? Highest average return Which? Does the asset with the highest average return also have the highest variance of returns? Data for Figure 11.1 Yearly returns from 1926-2015 for the S&P 500, small stocks, corporate bonds, world portfolio, Treasury bills, and inflation (as measured by the CPI). Year S&P 500 Small Stocks Corp Bonds World Portfolio Treasury Bills 1926 0.111382 -0.072000 0.062852 0.228000 0.031943 -0.011876 1927 0.371260 0.257543 0.065504 0.253257 0.031247 -0.021635 1928 0.433079 0.468723 0.033772 0.334633 0.038241 -0.012285 1929 -0.089069 -0.504667 0.043206 -0.076923 0.047367 0.007463 1930 -0.252573 -0.455830 0.063433 -0.225738 0.023474 -0.064198 1931 -0.438580 -0.502165 -0.023803 -0.393052 0.010230 -0.092348 1932 -0.088612 0.086957 0.121985 0.030303 0.00805S -0.104651 1933 0.528949 1.872000 0.052552 0.664488 0.002933 0.009740 1934 -0.023405 0.252089 0.097282 0.025524 0.001547 0.012862 1935 0.472081 0.647386 0.068602 0.227824 0.001652 0.031746 0.328010 0.875084 0.062197 0.192827 0.001749 0.012308 1937 -0.352577 -0.534030 0.025456 -0.169499 0.003187 0.030395 1938 0.331991 0.262751 0.043571 0.056139 0.000407 -0.029499 1939 -0.009096 0.001836 0.042473 -0.014406 0.000075 0.000000 1940 -0.100825 -0.123396 0.045124 0.035282 -0.000582 0.009119 1941 -0.117673 -0.137282 0.017882 0.187439 0.000422 0.099398 1936 1943 1944 1945 1946 1947 1948 1949 1950 1951 1952 1953 1954 1955 1956 1957 1958 1959 1960 1961 1962 1963 1964 1965 1967 1968 1969 1970 1971 1972 1973 1974 1975 1976 1977 1978 1979 1980 1981 1982 0.257576 0.196935 0.364606 -0.081804 0.052401 0.030990 0.180648 0.305792 0.245529 0.18S011 -0.010987 0.524037 0.314288 0.066270 -0.108535 0.433444 0.119044 0.004830 0.268114 -0.087840 0.226913 0.163576 0.123558 -0.101046 0.239425 0.110023 -0.084656 0.039857 0.143255 0.189356 -0.147912 -0.265389 0.372500 0.236746 -0.073880 0.064399 0.183529 0.322665 -0.0S0S30 0214833 0224997 0.061523 0.316476 0.186034 0.051709 0.166084 0.316862 -0.031043 0.304659 0.076194 0.100787 0013205 0.375778 0229603 0.333633 0.285786 0.210415 -0.091044 UA040 1.000000 0.604078 0.826647 -0.126085 -0.026580 -0.066086 0.215017 0.459082 0.097671 0.064718 -0.059851 0.652319 0.221095 0.034592 -0.150527 0.709232 0.186804 -0.050042 0.308362 -0.129 502 0.180929 0.194053 0.363655 -0.073020 0.779159 0.476107 -0.322186 -0.045027 0.163471 0.042220 -0.359362 -0.273271 0.827689 0.571158 0.199153 0.2044200 0.396976 0.291406 0.146172 0.322502 0.480478 -0.024955 0.291249 0.059082 -0.092043 0.202876 0.014882 -0.363252 0.417989 0.220748 0.137919 -0.010961 0.200561 0.215107 0.320803 -0.119749 -0.012600 -0.024901 0.033648 0.031013 0.035119 0.025578 0.004497 0.032072 0.043267 0.018908 -0.002101 0.034268 0.020612 0.046978 0.010754 -0.012923 0.044688 0.008487 0.001569 0.062221 0.036809 0.062038 0.031670 0.039876 0.020821 -0.002550 -0.011624 0.224570 -0.024591 0.111788 0.096820 0.083226 0.029869 0.002332 0.110394 0.145568 0.0SS102 0.018334 -0.015579 -0.049761 0.089767 0.348984 0.073167 0.171031 0.294865 0.209130 -0.015278 0.137929 0.153096 0.086061 0.158685 0.106420 0.146619 -0.024347 0219912 0.042387 0.108472 0.109077 -0.030366 0.116935 0.198947 -0.102399 0.110316 -0.151238 0.031962 -0.057298 0.054209 0.254772 0.224464 0.158215 0.048380 0.498225 0.247387 0.065810 -0.060174 0.344562 0.233035 0.034919 0.207775 -0.062116 0.153811 0.112465 0.098323 -0.101164 0.212827 0.139405 -0.038576 -0.019840 0.195673 0.235470 -0.145057 -0.244795 0.344929 0.142118 0.020020 0.182157 0.126705 0.277209 -0.033045 0.112723 0.232802 0.057733 0.417705 0.422988 0.167637 0.239504 0.171936 -0.16171 0.189665 -0.046597 0.231287 0.055836 0.213178 0.139931 0.162270 0.247953 0.253544 -0.129282 II 2016 0.003396 0.003215 0.003211 0.003521 0.004611 0.009790 0.011061 0.012134 0.014833 0.016420 0.017800 0.008626 0.015551 0.024215 0.031286 0.014151 0.028153 0.025824 0.021590 0.027240 0.031514 0.035182 0.039620 0.047050 0.041473 0.052941 0.065913 0.063829 0.043171 0.038911 0.070587 0.080781 0.058211 0.051556 0.051520 0.073082 0.106898 0.115227 0.148559 0.106643 0.088471 0.099558 0.076766 0.060571 0.053844 0.063228 0.082206 0.076800 0.055065 0.034015 0.028993 0.038800 0.055318 0.0S1450 0.050819 0.047812 0.045609 0.057560 UYU411 0.027638 0.024450 0.021480 0.182243 0.088933 0.02903 -0.021164 0.059459 0.061224 0.006410 0.007962 -0.002899 0.004777 0.028526 0.029276 0.017964 0.017647 0.013006 0.007133 0.012748 0.016783 0.009629 0.019074 0.034750 0.031008 0.046366 0.062275 0.055242 0.033120 0.034126 0.087000 0.123275 0.069615 0.048229 0.067202 0.090349 0.133082 0.125208 0.089119 0.037975 0.039328 0.039430 0.037934 0.010886 0.044231 0.044100 0.046561 0.061004 0.030813 0.028968 0.027553 0.026523 0.025554 0.033223 0.016881 0.016074 0.026971 0.033838 1983 1984 1985 1986 1987 1988 1989 1990 1991 1992 1993 1994 1995 1996 1997 1998 1999 2000 1996 1997 1998 1999 2000 2001 2002 2003 2004 2005 2006 2007 2008 2009 2010 2011 2012 2013 2014 2015 0.229603 0333633 0.285786 0.210415 -0.091044 -0.118858 -0.221005 0.286846 0.108820 0.049114 0.157950 0.054937 -0.369976 0.264635 0.150640 0.021118 0.160032 0.323885 0.136884 0.013838 0.215107 0.320803 -0.119749 -0.012600 -0.024901 0.327806 -0.056243 0.691508 0.313921 0.039876 0.263790 -0.111001 -0.458645 1.121272 0.336100 -0.071553 0.213115 0508143 -0.045410 -0.231836 0.042387 0.108472 0.109077 -0.030366 0.116935 0.114614 0.111815 0.092294 0.065101 0.077340 0.041671 0.047424 0.134495 0.000180 0.079724 0.147028 0.045135 -0.030670 0.116575 0.012582 0.139931 0.162270 0.247953 0.253544 -0.129282 -0.165210 -0.195412 0.337610 0.152466 0.100233 0.206522 0.095660 -0.403341 0.307927 0.123385 -0.050167 0.165374 0.273649 0.055036 0.004941 0.051450 0.050819 0.047812 0.045609 0.057560 0.032787 0.016340 0.010183 0.012004 0.029633 0.047856 0.046748 0.014743 0.000967 0.001215 0.000428 0.000565 0.000277 0.000165 0.000092 0.033223 0.016881 0.016074 0.026971 0.033838 0.015633 0.023569 0.018797 0.032749 0.034167 0.025265 0.040859 0.001012 0.027087 0.014958 0.029668 0.017326 0.015180 0.007476 0.007240 quirements 1 In cell E13, by using cell references, calculate the average return for the S&P 500 (1 pt.). 2 In cell F13, by using cell references, calculate the average return for the Small Stocks (1 pt.). 3 In cell G13, by using cell references, calculate the average return for the Corp Bonds (1 pt.). 4 In cell H13, by using cell references, calculate the average return for the World Portfolio (1 pt.). 5 In cell 113, by using cell references, calculate the average return for the Treasury Bills (1 pt.). 6 In cell E18, by using the VAR function and cell references, calculate the variance of returns for the S&P 500 (1 pt.). 7 In cell F18, by using the VAR function and cell references, calculate the variance of returns for the Small Stocks (1 pt.). 8 In cell G18, by using the VAR function and cell references, calculate the variance of returns for the Corp Bonds (1 pt.). 9 In cell H18, by using the VAR function and cell references, calculate the variance of returns for the World Portfolio (1 pt.). 10 In cell 118, by using the VAR function and cell references, calculate the variance of returns for the Treasury Bills (1 pt.). 11 In cell E19, by using the STDEV function and cell references, calculate the standard deviation of returns for the S&P 500 (1 pt.). In cell F19, by using the STDEV function and cell references, calculate the standard deviation of returns for the Small Stocks (1 pt.). In cell G19, by using the STDEV function and cell references, calculate the standard deviation of returns for the Corp Bonds (1 pt.). In cell H19, by using the STDEV function and cell references, calculate the standard deviation of returns for the World Portfolio (1 pt.). In cell 119, by using the STDEV function and cell references, calculate the standard deviation of returns for the Treasury Bills (1 pt.). In cell E23, by using the MAX function and cell references, calculate the highest standard deviation of returns from all the assets (1 pt.). 18 In cell G23, type either S&P 500, Small Stocks, Corp Bonds, World Portfolio or Treasury Bills depending on which asset has the highest standard deviation of returns (1 pt.). In cell E24, by using the MAX function and cell references, calculate the highest average return from all the assets (1 pt.). In cell G24, type either S&P 500, Small Stocks, Corp Bonds, World Portfolio or Treasury Bills depending on which asset has the highest average return (1 pt.). In cell 125, type either Yes or No depending on whether the asset with the highest average return also have the highest variance of returns
Step by Step Solution
There are 3 Steps involved in it

Get step-by-step solutions from verified subject matter experts