

Question: Using the data presented for Ruez Company, prepare a schedule showing a vertical analysis for 2017 and 2018. Using the data presented for Ruez Company,
Using the data presented for Ruez Company, prepare a schedule showing a vertical analysis for 2017 and 2018.
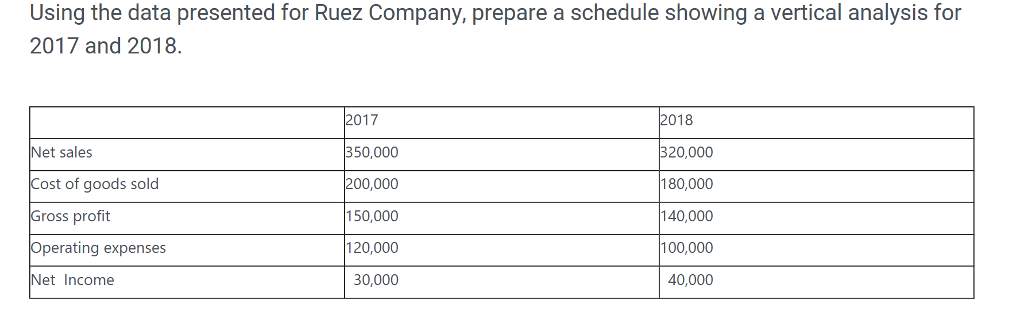
Using the data presented for Ruez Company, prepare a schedule showing a vertical analysis for 2017 and 2018. Net sales Cost of goods sold Gross profit Operating expenses Net Income 2017 350,000 200,000 150,000 120,000 2018 320,000 180,000 100,000 0,000 40,000
Step by Step Solution
There are 3 Steps involved in it
1 Expert Approved Answer
Step: 1 Unlock

Question Has Been Solved by an Expert!
Get step-by-step solutions from verified subject matter experts
Step: 2 Unlock
Step: 3 Unlock