

Question: Using the data provided: a) Calculate ratios for the pink shaded areas. Prior ratios are given. Use formulas. b) Using the ratios you calculated and
Using the data provided:
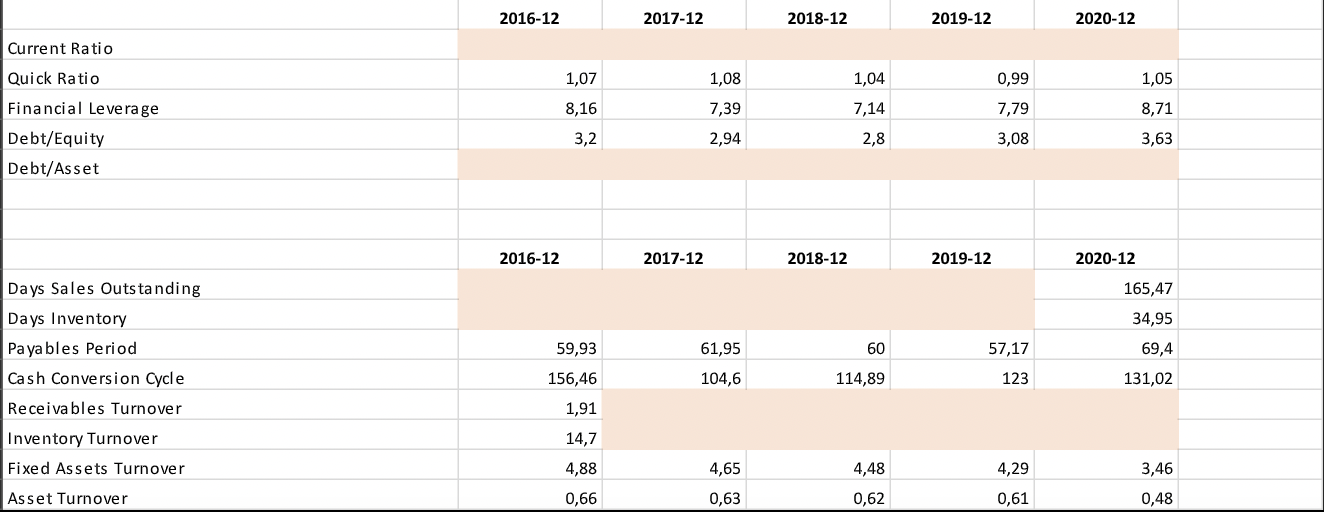
a) Calculate ratios for the pink shaded areas. Prior ratios are given. Use formulas.
b) Using the ratios you calculated and other ratios provided in the file, analyze the profitability and efficiency of the company for the relevant years.
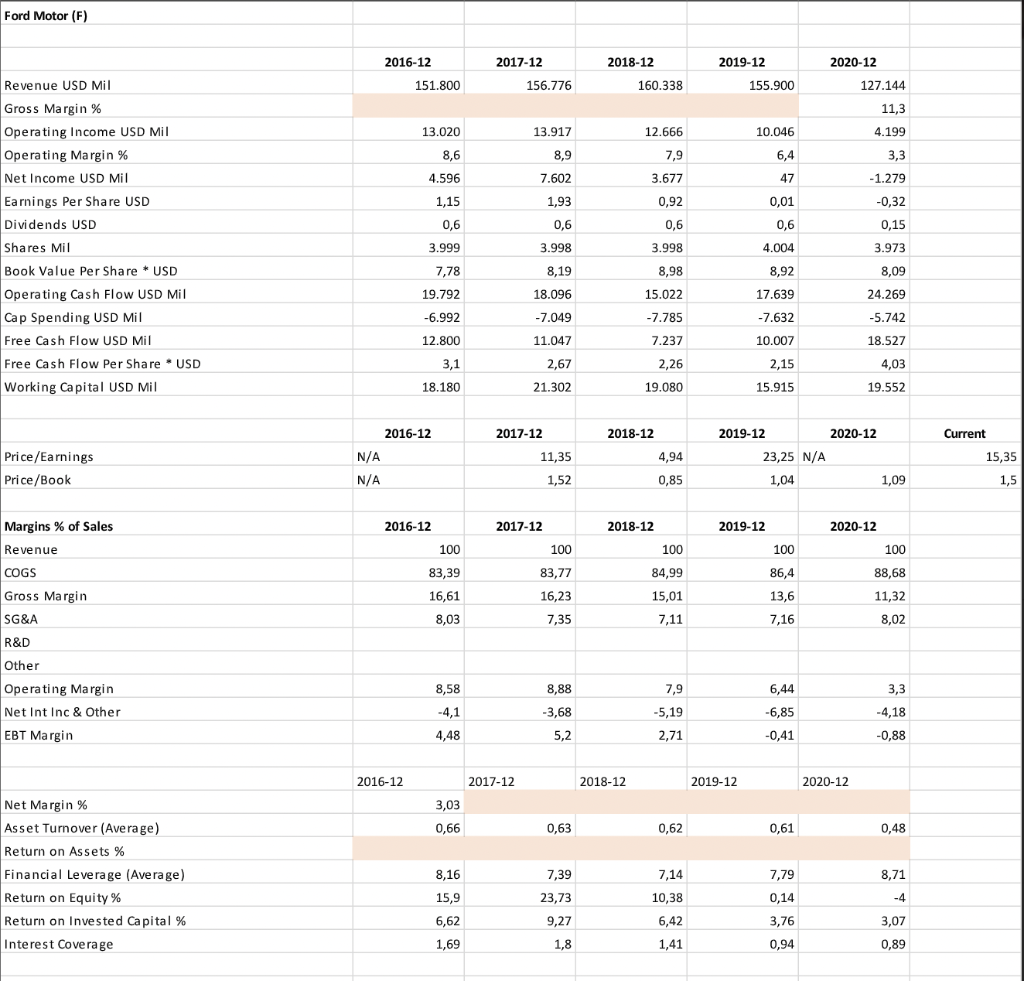
Ford Motor (F) 2018-12 2019-12 2016-12 151.800 2017-12 156.776 2020-12 127.144 Revenue USD Mil 160.338 155.900 11,3 13.020 13.917 12.666 10.046 4.199 8,6 8,9 7,9 6,4 3,3 4.596 7.602 3.677 47 - 1.279 1,15 1,93 0,01 0,92 0,6 -0,32 0,15 0,6 0,6 0,6 Gross Margin % Operating Income USD Mil Operating Margin % Net Income USD Mil Earnings Per Share USD Dividends USD Shares Mil Book Value Per Share * USD Operating Cash Flow USD Mil Cap Spending USD Mil Free Cash Flow USD Mil Free Cash Flow Per Share - USD Working Capital USD Mil 3.999 3.998 3.998 4.004 3.973 8,19 8,98 8,92 7,78 19.792 8,09 24.269 18.096 15.022 17.639 -6.992 -7.049 -7.785 -7.632 -5.742 12.800 11.047 7.237 10.007 18.527 3,1 2,26 2,67 21.302 2,15 15.915 4,03 19.552 18.180 19.080 2017-12 2018-12 2019-12 2020-12 Current Price/Earnings Price/Book 2016-12 N/A N/A 11,35 1,52 4,94 0,85 23,25 N/A 1,04 15,35 1,5 1,09 2016-12 2019-12 2020-12 100 100 100 Margins % of Sales Revenue COGS Gross Margin SG&A 83,39 2017-12 100 83,77 16,23 7,35 2018-12 100 84,99 15,01 7,11 86,4 16,61 13,6 7,16 88,68 11,32 8,02 8,03 R&D 8,58 8,88 6,44 3,3 Other Operating Margin Net Int Inc & Other EBT Margin -3,68 -4,1 4,48 7,9 -5,19 2,71 -6,85 -0,41 -4,18 -0,88 5,2 2016-12 2017-12 2018-12 2019-12 2020-12 3,03 0,66 0,63 0,62 0,61 0,48 Net Margin % Asset Turnover (Average) Return on Assets % Financial Leverage (Average) Return on Equity% Return on invested Capital % Interest Coverage 8,16 7,39 7,14 8,71 7,79 0,14 15,9 23,73 -4 6,62 1,69 3,07 10,38 6,42 1,41 9,27 1,8 3,76 0,94 0,89 2016-12 2017-12 2018-12 2019-12 2020-12 Current Ratio Quick Ratio 1,07 1,08 1,04 0,99 1,05 Financial Leverage 8,16 7,39 7,14 7,79 8,71 3,2 2,94 2,8 3,08 3,63 Debt/Equity Debt/Asset 2016-12 2017-12 2018-12 2019-12 2020-12 165,47 Days Sales Outstanding Days Inventory Payables Period 34,95 59,93 61,95 60 57,17 69,4 Cash Conversion Cycle 156,46 104,6 114,89 123 131,02 1,91 Receivables Turnover Inventory Turnover Fixed Assets Turnover 14,7 4,88 4,65 4,48 4,29 3,46 Asset Turnover 0,66 0,63 0,62 0,61 0,48 Ford Motor (F) 2018-12 2019-12 2016-12 151.800 2017-12 156.776 2020-12 127.144 Revenue USD Mil 160.338 155.900 11,3 13.020 13.917 12.666 10.046 4.199 8,6 8,9 7,9 6,4 3,3 4.596 7.602 3.677 47 - 1.279 1,15 1,93 0,01 0,92 0,6 -0,32 0,15 0,6 0,6 0,6 Gross Margin % Operating Income USD Mil Operating Margin % Net Income USD Mil Earnings Per Share USD Dividends USD Shares Mil Book Value Per Share * USD Operating Cash Flow USD Mil Cap Spending USD Mil Free Cash Flow USD Mil Free Cash Flow Per Share - USD Working Capital USD Mil 3.999 3.998 3.998 4.004 3.973 8,19 8,98 8,92 7,78 19.792 8,09 24.269 18.096 15.022 17.639 -6.992 -7.049 -7.785 -7.632 -5.742 12.800 11.047 7.237 10.007 18.527 3,1 2,26 2,67 21.302 2,15 15.915 4,03 19.552 18.180 19.080 2017-12 2018-12 2019-12 2020-12 Current Price/Earnings Price/Book 2016-12 N/A N/A 11,35 1,52 4,94 0,85 23,25 N/A 1,04 15,35 1,5 1,09 2016-12 2019-12 2020-12 100 100 100 Margins % of Sales Revenue COGS Gross Margin SG&A 83,39 2017-12 100 83,77 16,23 7,35 2018-12 100 84,99 15,01 7,11 86,4 16,61 13,6 7,16 88,68 11,32 8,02 8,03 R&D 8,58 8,88 6,44 3,3 Other Operating Margin Net Int Inc & Other EBT Margin -3,68 -4,1 4,48 7,9 -5,19 2,71 -6,85 -0,41 -4,18 -0,88 5,2 2016-12 2017-12 2018-12 2019-12 2020-12 3,03 0,66 0,63 0,62 0,61 0,48 Net Margin % Asset Turnover (Average) Return on Assets % Financial Leverage (Average) Return on Equity% Return on invested Capital % Interest Coverage 8,16 7,39 7,14 8,71 7,79 0,14 15,9 23,73 -4 6,62 1,69 3,07 10,38 6,42 1,41 9,27 1,8 3,76 0,94 0,89 2016-12 2017-12 2018-12 2019-12 2020-12 Current Ratio Quick Ratio 1,07 1,08 1,04 0,99 1,05 Financial Leverage 8,16 7,39 7,14 7,79 8,71 3,2 2,94 2,8 3,08 3,63 Debt/Equity Debt/Asset 2016-12 2017-12 2018-12 2019-12 2020-12 165,47 Days Sales Outstanding Days Inventory Payables Period 34,95 59,93 61,95 60 57,17 69,4 Cash Conversion Cycle 156,46 104,6 114,89 123 131,02 1,91 Receivables Turnover Inventory Turnover Fixed Assets Turnover 14,7 4,88 4,65 4,48 4,29 3,46 Asset Turnover 0,66 0,63 0,62 0,61 0,48
Step by Step Solution
There are 3 Steps involved in it

Get step-by-step solutions from verified subject matter experts