

Question: Using the data shown below in Table 1 , compute the mean square error, mean absolute deviation, and mean absolute percentage error for the forecasts
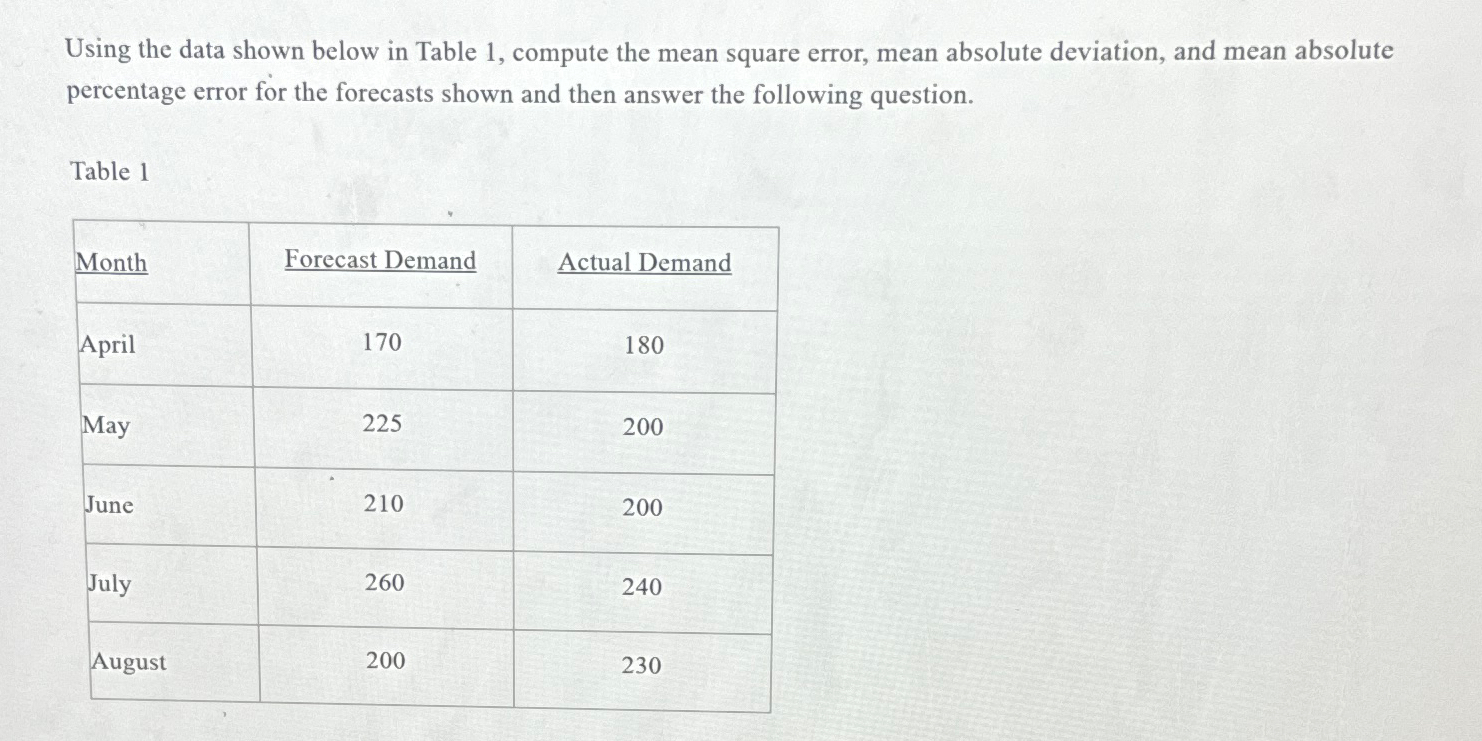
Using the data shown below in Table compute the mean square error, mean absolute deviation, and mean absolute percentage error for the forecasts shown and then answer the following question.
Table
tableMonthForecast Demand,Actual DemandAprilMayJuneJulyAugust
Step by Step Solution
There are 3 Steps involved in it
1 Expert Approved Answer
Step: 1 Unlock

Question Has Been Solved by an Expert!
Get step-by-step solutions from verified subject matter experts
Step: 2 Unlock
Step: 3 Unlock