

Question: Using the data shown in the table here, , that contains historical monthly prices and dividends (pay at the end of the month) for Ford
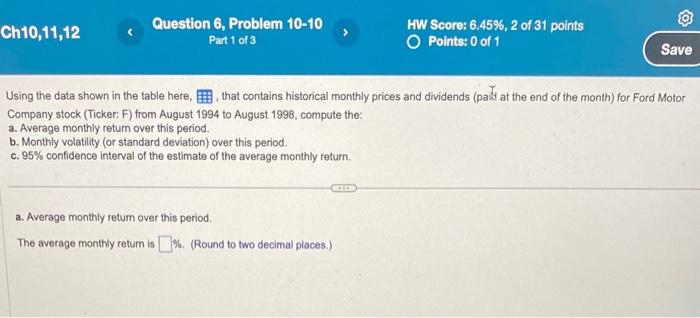
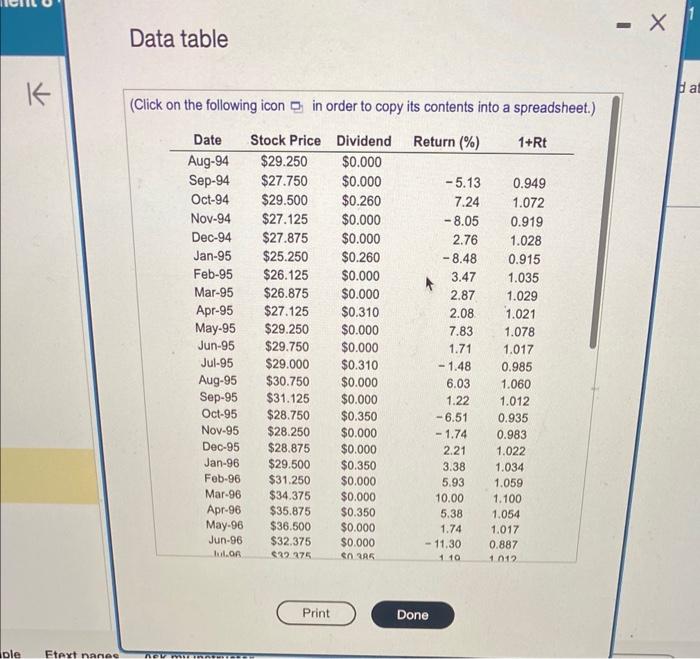
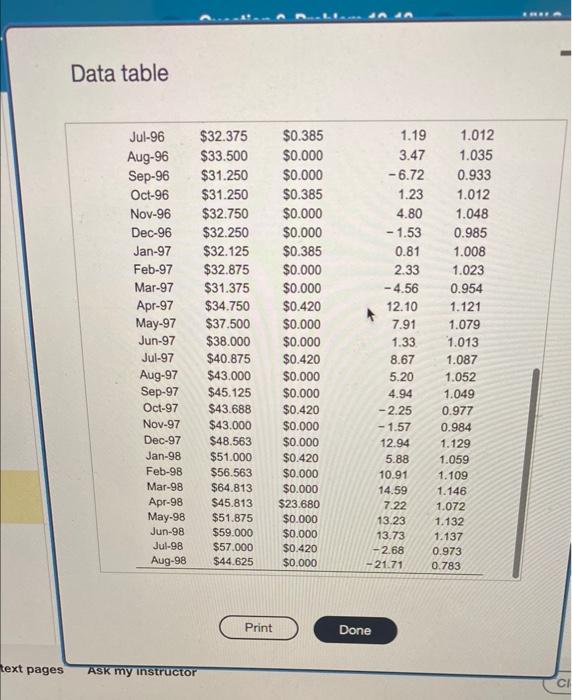
Using the data shown in the table here, , that contains historical monthly prices and dividends (pay at the end of the month) for Ford Motor Company stock (Ticker: F) from August 1994 to August 1998, compute the: a. Average monthly retum over this period. b. Monthly volatility (or standard deviation) over this period. c. 95% confidence interval of the estimate of the average monthly return. a. Average monthly retum over this period. The average monthly retum is \%. (Round to two decimal places.) Data table (Click on the following icon in order to copy its contents into a spreadsheet.) Data table
Step by Step Solution
There are 3 Steps involved in it
1 Expert Approved Answer
Step: 1 Unlock

Question Has Been Solved by an Expert!
Get step-by-step solutions from verified subject matter experts
Step: 2 Unlock
Step: 3 Unlock