

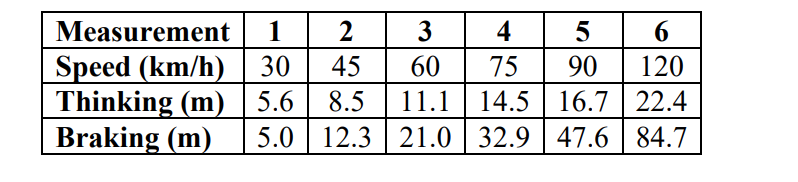
Question: USING THE DATA TABLE IMAGE PROVIDED SOLVE VIA MATLAB CODE: Problem 9 . 4 ( Data from Problem 9 . 1 ) Let s try
USING THE DATA TABLE IMAGE PROVIDED SOLVE VIA MATLAB CODE:
Problem
Data from Problem
Lets try one more type of best fit curve. Write a MATLAB script or function your choice to
solve the linear system of equations to perform linear regression and fit a polynomial to each
set of experimental data thinking AND braking Fit each set of data with a polynomial of the
following form:
y aax ax
where x is speed, and y is the thinking or braking data. You will create best fit curve for each
set of data thinking AND braking Solve the linear system of equations for the unknown
coefficients, a and a of each best fit curve. Then, quantify the error of each best fit curve using
the equation to calculate the coefficient of determination, r
Create a figure showing the experimental data for both thinking AND braking and each best
fit curve. Plot all the data and curves on one plot. Include the following information:
Experimental data Plot the speed data on the xaxis and the thinking or braking data on
the yaxis. Use any color and marker your choice without a line to plot the data points.
Use a different color and marker for the thinking data and the braking data.
Best fit curves For each curve, plot the speed data on the xaxis and the best fit curve on
the yaxis. Use any line style and color besides the default styles and colors.
Label the xaxis and the yaxis.
Create a descriptive figure legend.
Create a descriptive figure title.
show in the diary file that you have calculated the
coefficient of determination for each best fit curve.
Step by Step Solution
There are 3 Steps involved in it
1 Expert Approved Answer
Step: 1 Unlock

Question Has Been Solved by an Expert!
Get step-by-step solutions from verified subject matter experts
Step: 2 Unlock
Step: 3 Unlock