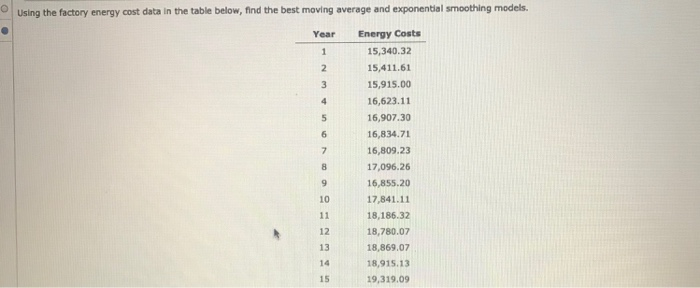
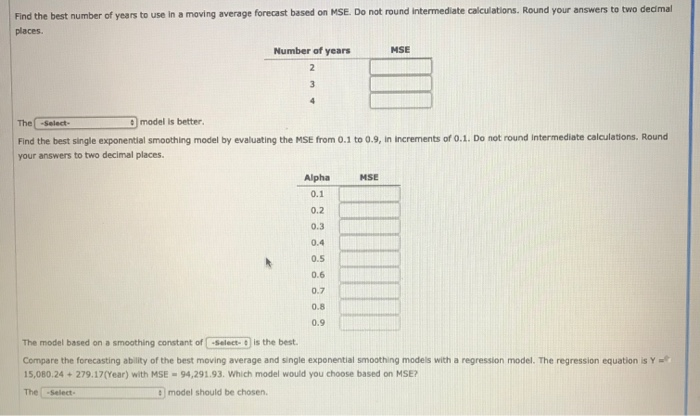
Question: Using the factory energy cost data in the table below, find the best moving average and exponential smoothing models. Year Energy Costs 15,340.32 15,411.61 15,915.00

Using the factory energy cost data in the table
Using the factory energy cost data in the table below, find the best moving average and exponential smoothing models. Year Energy Costs 15,340.32 15,411.61 15,915.00 16,623.11 16,907.30 16,834.71 16,809.23 17,096.26 16,855.20 17,841.11 18,186.32 18,780.07 18,869.07 18,915.13 19,319.09 Find the best number of years to use in a moving average forecast based on MSE. Do not round Intermediate calculations. Round your answers to two decimal places Number of years MSE The Select model is better. Find the best single exponential smoothing model by evaluating the MSE from 0.1 to 0.9, in increments of 0.1. Do not round Intermediate calculations. Round your answers to two decimal places, Alpha MSE 0.1 0.2 0.3 014 05 0. 0.8 0.9 The model based on a smoothing constant of Solace is the best. Compare the forecasting ability of the best moving average and single exponential smoothing models with a regression model. The regression equation is Y 15,080.24 - 279.17(Year) with MSE - 94,291.93. Which model would you choose based on MSE? The select model should be chosen

Step by Step Solution

There are 3 Steps involved in it

1 Expert Approved Answer
Step: 1 Unlock blur-text-image
Question Has Been Solved by an Expert!

Get step-by-step solutions from verified subject matter experts

Step: 2 Unlock
Step: 3 Unlock

Students Have Also Explored These Related General Management Questions!