

Question: Using the factory energy cost data in Exhibit 11.11, find the best moving average and exponential smoothing models. Compare their forecasting ability with the regression
Using the factory energy cost data in Exhibit 11.11, find the best moving average and exponential smoothing models. Compare their forecasting ability with the regression model developed in the chapter. Which model would you choose and why?
kMSE
2 ... 267109.98
3 ... 420795.85
4 ... 544054.44
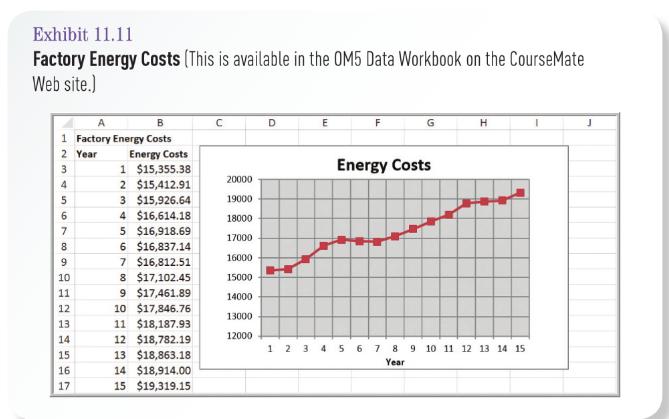
Exhibit 11.11 Factory Energy Costs (This is available in the OM5 Data Workbook on the CourseMate Web site.) B D. E H 1 Factory Energy Costs 2 Year Energy Costs 1 $15,355.38 2 $15,412.91 3 $15,926.64 Energy Costs 3 20000 4 5 19000 4 $16,614.18 5 $16,918.69 6 $16,837.14 7 $16,812.51 8 $17,102.45 9 $17,461.89 10 $17,846.76 18000 7 17000 8 16000 9 10 15000 11 14000 12 13000 13 11 $18,187.93 12000 14 12 $18,782.19 1 2 3 4 5 6 7 8 9 10 11 12 13 14 15 15 13 $18,863.18 Year 16 14 $18,914.00 17 15 $19,319.15
Step by Step Solution
3.17 Rating (161 Votes )
There are 3 Steps involved in it
k MSE 2 26710998 3 42079585 4 54405444 For the moving average models k 2 is best For exponential smo... View full answer

Get step-by-step solutions from verified subject matter experts
Document Format (1 attachment)
546-B-M-L-O-M (4241).docx
120 KBs Word File