

Question: Using the financial statement data provided in Exhibits 2, 3, and 4, match the companies with their industry. I Since oppornunities and constraints tend to
Using the financial statement data provided in Exhibits 2, 3, and 4, match the companies with their industry.
 I
I
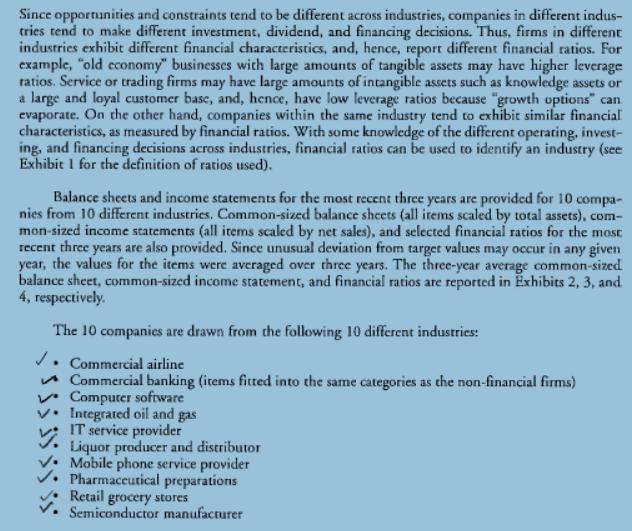
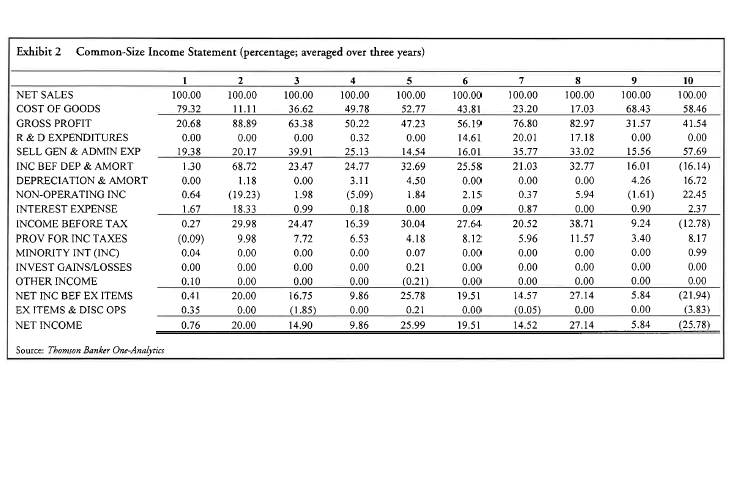
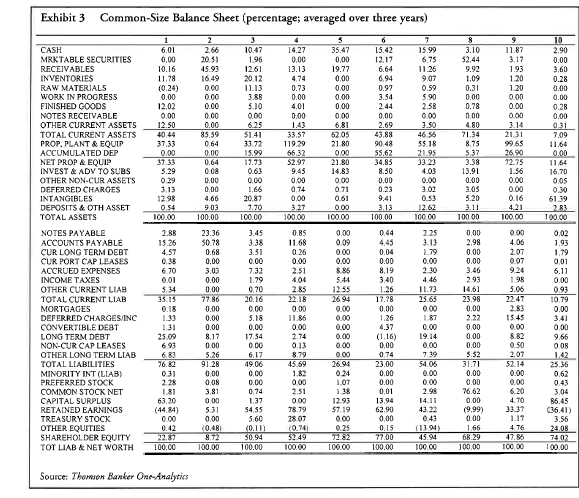
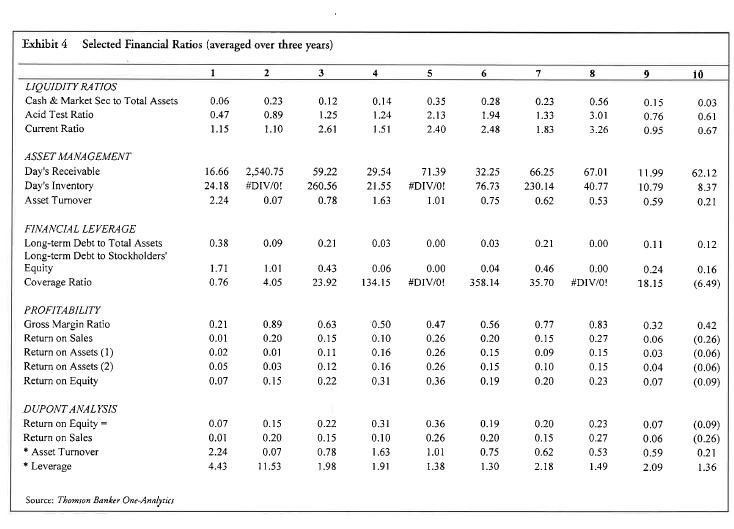
Since oppornunities and constraints tend to be different across industries, companies in different indus- tries tend to make different investment, dividend, and financing decisions. Thus, firms in different industries exhibit different financial characteristics, and, hence, report different financial ratios. For example, "old cconomy" businesses with large amounts of tangible assets may have higher leverage ratios. Service or trading firms may have large amounts of intangible assets such as knowledge assets or a large and loyal customer base, and, hence, have low leverage ratios because "growth options" can evaporate. On the other hand, companies within the same industry tend to exhibit similar financial characteristics, as measured by financial ratios. With some knowledge of the different operating, invest- ing, and financing decisions across industries, financial ratios can be used to identify an industry (see Exhibit 1 for the definition of ratios used). DSS Balance sheets and income statements for the most recent three years are provided for 10 compa- nies from 10 different industries. Common-sized balance sheets (all items scaled by total assets), com- mon-sized income statements (all items scaled by net sales), and selected financial ratios for the most recent three years are also provided. Since unusual deviation from target values may occur in any given year, the values for the items were averaged over three years. The three-year average common-sized balance sheet, common-sized income statement, and financial ratios are reported in Exhibits 2, 3, and 4, respectively. The 10 companies are drawn from the following 10 different industries: /. Commercial airline Commercial banking (items fitted into the same categories as the non-financial firms) Computer software Integrated oil and gas IT service provider Liquor producer and distributor Mobile phone service provider Pharmaccutical preparations Retail grocery stores Semiconductor manufacturer Since oppornunities and constraints tend to be different across industries, companies in different indus- tries tend to make different investment, dividend, and financing decisions. Thus, firms in different industries exhibit different financial characteristics, and, hence, report different financial ratios. For example, "old cconomy" businesses with large amounts of tangible assets may have higher leverage ratios. Service or trading firms may have large amounts of intangible assets such as knowledge assets or a large and loyal customer base, and, hence, have low leverage ratios because "growth options" can evaporate. On the other hand, companies within the same industry tend to exhibit similar financial characteristics, as measured by financial ratios. With some knowledge of the different operating, invest- ing, and financing decisions across industries, financial ratios can be used to identify an industry (see Exhibit 1 for the definition of ratios used). DSS Balance sheets and income statements for the most recent three years are provided for 10 compa- nies from 10 different industries. Common-sized balance sheets (all items scaled by total assets), com- mon-sized income statements (all items scaled by net sales), and selected financial ratios for the most recent three years are also provided. Since unusual deviation from target values may occur in any given year, the values for the items were averaged over three years. The three-year average common-sized balance sheet, common-sized income statement, and financial ratios are reported in Exhibits 2, 3, and 4, respectively. The 10 companies are drawn from the following 10 different industries: /. Commercial airline Commercial banking (items fitted into the same categories as the non-financial firms) Computer software Integrated oil and gas IT service provider Liquor producer and distributor Mobile phone service provider Pharmaccutical preparations Retail grocery stores Semiconductor manufacturer
Step by Step Solution
There are 3 Steps involved in it
To solve this question you need to analyze the financial statement data in Exhibits 2 3 and 4 then match the companies to the industries based on dist... View full answer

Get step-by-step solutions from verified subject matter experts