

Question: Using the following data: 3- If =0.2 a. what are the upper and lower control limits for X chart? b. Draw the graph of X
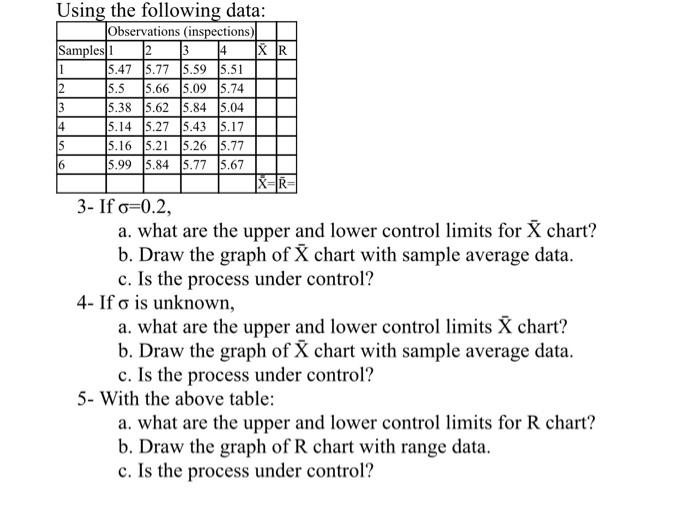
Using the following data: 3- If =0.2 a. what are the upper and lower control limits for X chart? b. Draw the graph of X chart with sample average data. c. Is the process under control? 4- If is unknown, a. what are the upper and lower control limits X chart? b. Draw the graph of X chart with sample average data. c. Is the process under control? 5- With the above table: a. what are the upper and lower control limits for R chart? b. Draw the graph of R chart with range data. c. Is the process under control
Step by Step Solution
There are 3 Steps involved in it
1 Expert Approved Answer
Step: 1 Unlock

Question Has Been Solved by an Expert!
Get step-by-step solutions from verified subject matter experts
Step: 2 Unlock
Step: 3 Unlock