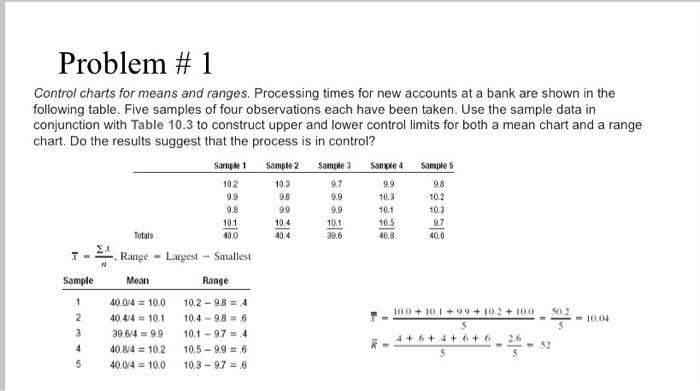
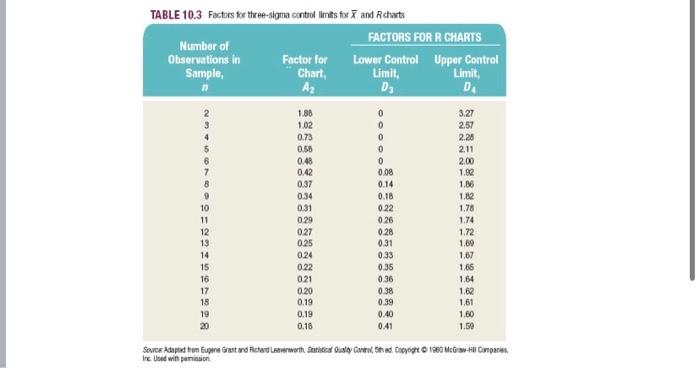
Question: Problem #1 Control charts for means and ranges. Processing times for new accounts at a bank are shown in the following table. Five samples of

Problem #1 Control charts for means and ranges.
Problem #1 Control charts for means and ranges. Processing times for new accounts at a bank are shown in the following table. Five samples of four observations each have been taken. Use the sample data in conjunction with Table 10.3 to construct upper and lower control limits for both a mean chart and a range chart. Do the results suggest that the process is in control? Sample 1 Sample 2 Sample 3 Sample 4 102 Sample 5 9.9 9.9 10.3 9.8 9.9 10.4 40.4 9.7 9.9 9.9 101 39.6 10.3 10.1 10.5 40.8 98 102 10.3 9.7 40.0 101 40.0 Totals I- Sample Range - Largest - Smallest Mean Range 40.0/4 = 10.0 10.2 - 98 = 4 40.44 = 10.1 10.4 - 98 - 6 39,6/4 = 99 10.1 -97.4 40.8/4 = 102 10.5 - 9.9 = 6 40.0/4 = 100 10.3 - 9.7 = 6 1 2 3 50.2 10.04 T- 100+ 0.1 + 9 + 10.2 + 100 - 4 + 6 + 4 + 6 + 6 2.6 4 5 TABLE 10.3 Factors for three-signa control limits for 7 and charts FACTORS FOR R CHARTS Number of Observations in Factor for Lower Control Upper Control Sample, Chart, Limit, Limit Az B D. 1.88 1.02 0.73 0.50 0.48 0.22 9 10 11 12 13 14 15 16 17 18 19 20 BEURESYON 0.37 0.34 0.31 029 0.27 0.25 0.24 0.22 021 0.20 0.19 0.19 0.18 0 0 0 0 0.08 0.14 0.18 0.22 0.26 0.28 0.31 0.33 0.35 036 0.38 0.39 0.40 0.41 3.27 2.57 2.25 2.11 2.00 1.92 1.66 1.82 1.78 1.74 1.72 1.00 1.67 105 1.64 1.62 1.61 1.60 1.30 Sowes Adapted to Eugene Grant ord Fichard Leeverwerth. Strated Custy Corest, had. Copyright 1980 McGraw-Hill Companies, Ine Used with patio

Step by Step Solution

There are 3 Steps involved in it

1 Expert Approved Answer
Step: 1 Unlock blur-text-image
Question Has Been Solved by an Expert!

Get step-by-step solutions from verified subject matter experts

Step: 2 Unlock
Step: 3 Unlock

Students Have Also Explored These Related General Management Questions!