

Question: Control charts for means and ranges. Processing times for new accounts at a bank are shown in the following table. Five samples of four observations
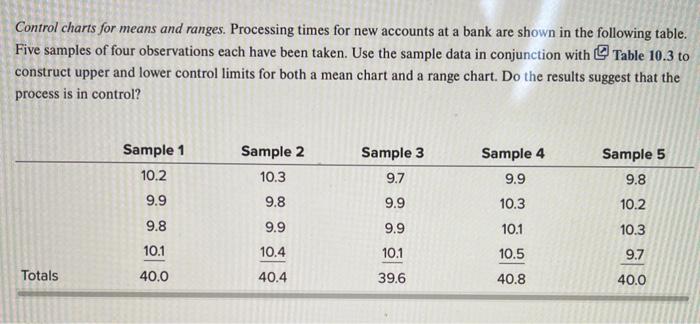
Control charts for means and ranges. Processing times for new accounts at a bank are shown in the following table. Five samples of four observations each have been taken. Use the sample data in conjunction with Table 10.3 to construct upper and lower control limits for both a mean chart and a range chart. Do the results suggest that the process is in control? Totals Sample 1 10.2 9.9 9.8 10.1 40.0 Sample 2 10.3 9.8 9.9 10.4 40.4 Sample 3 9.7 9.9 9.9 10.1 39.6 Sample 4 9.9 10.3 10.1 10.5 40.8 Sample 5 9.8 10.2 10.3 9.7 40.0
Control charts for means and ranges. Processing times for new accounts at a bank are shown in the following table. Five samples of four observations each have been taken. Use the sample data in conjunction with Table 10.3 to construct upper and lower control limits for both a mean chart and a range chart. Do the results suggest that the process is in control
Step by Step Solution
There are 3 Steps involved in it
1 Expert Approved Answer
Step: 1 Unlock

Question Has Been Solved by an Expert!
Get step-by-step solutions from verified subject matter experts
Step: 2 Unlock
Step: 3 Unlock