

Question: Using the following data, create a table in Excel that uses Excel formulas to calculate: 1 . The dollar and percent increase in each expense
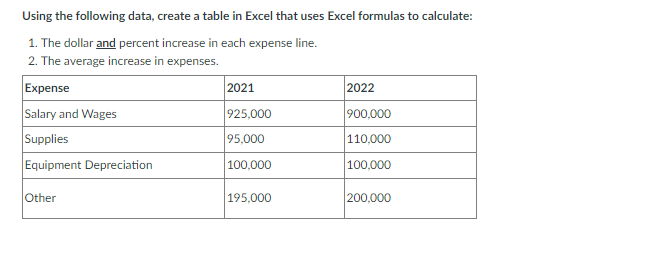
Using the following data, create a table in Excel that uses Excel formulas to calculate:
The dollar and percent increase in each expense line.
The average increase in expenses.
begintabularlll
hline Expense & &
hline Salary and Wages & &
hline Supplies & &
hline Equipment Depreciation & &
hline Other & &
hline
endtabular
Step by Step Solution
There are 3 Steps involved in it
1 Expert Approved Answer
Step: 1 Unlock

Question Has Been Solved by an Expert!
Get step-by-step solutions from verified subject matter experts
Step: 2 Unlock
Step: 3 Unlock