

Question: using the following data in excel complete the chart and compute, the MAD and MAPE and tracking signal. please include formulas for excel. begin{tabular}{|c|c|c|} hline
using the following data in excel complete the chart and compute, the MAD and MAPE and tracking signal. please include formulas for excel. 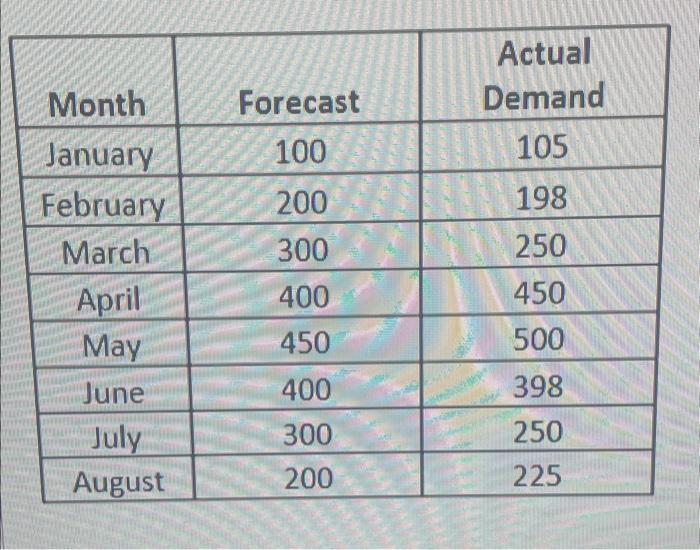
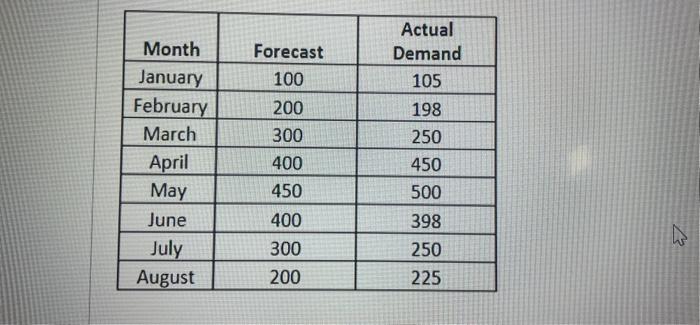
\begin{tabular}{|c|c|c|} \hline Month & Forecast & ActualDemand \\ \hline January & 100 & 105 \\ \hline February & 200 & 198 \\ \hline March & 300 & 250 \\ \hline April & 400 & 450 \\ \hline May & 450 & 500 \\ \hline June & 400 & 398 \\ \hline July & 300 & 250 \\ \hline August & 200 & 225 \\ \hline \end{tabular} \begin{tabular}{|c|c|c|} \hline Month & Forecast & ActualDemand \\ \hline January & 100 & 105 \\ \hline February & 200 & 198 \\ \hline March & 300 & 250 \\ \hline April & 400 & 450 \\ \hline May & 450 & 500 \\ \hline June & 400 & 398 \\ \hline July & 300 & 250 \\ \hline August & 200 & 225 \\ \hline \end{tabular}
Step by Step Solution
There are 3 Steps involved in it
1 Expert Approved Answer
Step: 1 Unlock

Question Has Been Solved by an Expert!
Get step-by-step solutions from verified subject matter experts
Step: 2 Unlock
Step: 3 Unlock