

Question: Using the following data: Samples 1 2 3 4 5 6 Observations (inspections) 3 5.59 5.09 5.84 5.43 5.26 5.77 1 5.47 5.5 5.38 5.14
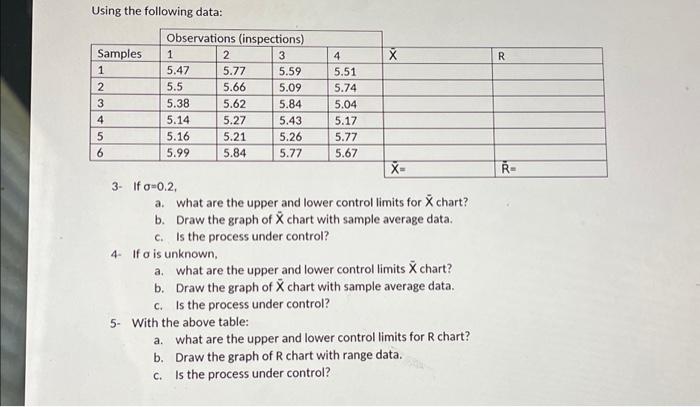
Using the following data: Samples 1 2 3 4 5 6 Observations (inspections) 3 5.59 5.09 5.84 5.43 5.26 5.77 1 5.47 5.5 5.38 5.14 5.16 5.99 2 5.77 5.66 5.62 5.27 5.21 5.84 4 5.51 5.74 5.04 5.17 5.77 5.67 X 5- With the above table: X= 3- If =0.2, a. what are the upper and lower control limits for X chart? b. Draw the graph of X chart with sample average data. Is the process under control? C. 4- If o is unknown, a. what are the upper and lower control limits X chart? Draw the graph of X chart with sample average data. b. C. Is the process under control? a. what are the upper and lower control limits for R chart? b. Draw the graph of R chart with range data. C. Is the process under control? R R=
Using the following data: 3- If =0.2, a. what are the upper and lower control limits for X chart? b. Draw the graph of X chart with sample average data. c. Is the process under control? 4. If is unknown, a. what are the upper and lower control limits X chart? b. Draw the graph of X chart with sample average data. c. Is the process under control? 5- With the above table: a. what are the upper and lower control limits for R chart? b. Draw the graph of R chart with range data. c. Is the process under control
Step by Step Solution
There are 3 Steps involved in it
1 Expert Approved Answer
Step: 1 Unlock

Question Has Been Solved by an Expert!
Get step-by-step solutions from verified subject matter experts
Step: 2 Unlock
Step: 3 Unlock