

Question: Using the following information develop a Gantt chart. Gantt Chart begin{tabular}{|l|l|l|l|} hline & Optimistic Estimate & Pessimistic Estimate & Most Likely Estimate hline Application
Using the following information develop a Gantt chart.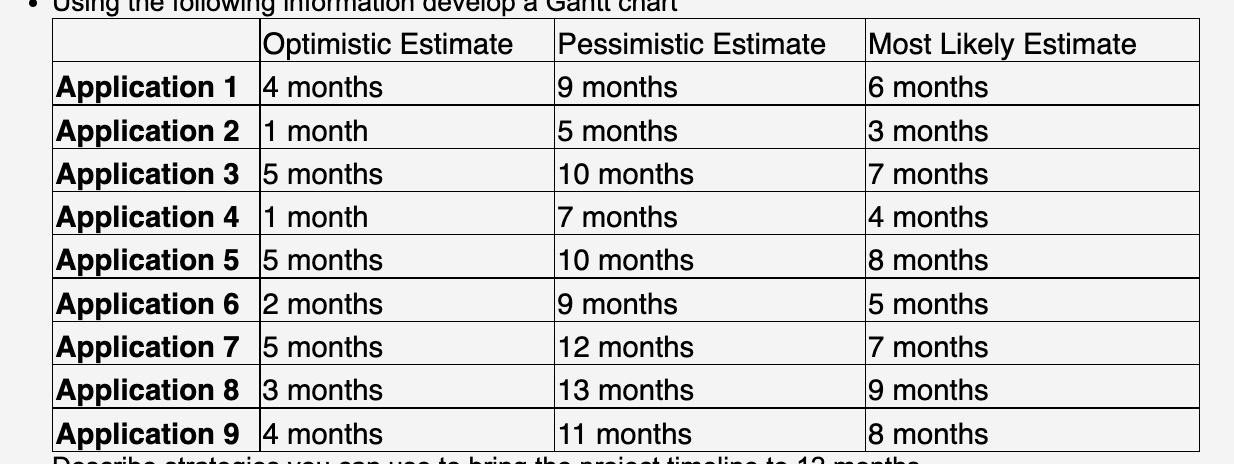 Gantt Chart
\begin{tabular}{|l|l|l|l|} \hline & Optimistic Estimate & Pessimistic Estimate & Most Likely Estimate \\ \hline Application 1 & 4 months & 9 months & 6 months \\ \hline Application 2 & 1 month & 5 months & 3 months \\ \hline Application 3 & 5 months & 10 months & 7 months \\ \hline Application 4 & 1 month & 7 months & 4 months \\ \hline Application 5 & 5 months & 10 months & 8 months \\ \hline Application 6 & 2 months & 9 months & 5 months \\ \hline Application 7 & 5 months & 12 months & 7 months \\ \hline Application 8 & 3 months & 13 months & 9 months \\ \hline Application 9 & 4 months & 11 months & 8 months \\ \hline \end{tabular} \begin{tabular}{|l|l|l|l|} \hline & Optimistic Estimate & Pessimistic Estimate & Most Likely Estimate \\ \hline Application 1 & 4 months & 9 months & 6 months \\ \hline Application 2 & 1 month & 5 months & 3 months \\ \hline Application 3 & 5 months & 10 months & 7 months \\ \hline Application 4 & 1 month & 7 months & 4 months \\ \hline Application 5 & 5 months & 10 months & 8 months \\ \hline Application 6 & 2 months & 9 months & 5 months \\ \hline Application 7 & 5 months & 12 months & 7 months \\ \hline Application 8 & 3 months & 13 months & 9 months \\ \hline Application 9 & 4 months & 11 months & 8 months \\ \hline \end{tabular}
Step by Step Solution
There are 3 Steps involved in it

Get step-by-step solutions from verified subject matter experts