

Question: Using the following sample results (50 items in each sample), calculate the requested questions a. What are the three-sigma control limits (upper and lower) for
Using the following sample results (50 items in each sample), calculate the requested questions
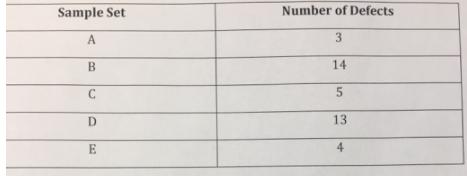
a. What are the three-sigma control limits (upper and lower) for the appropriate p-Chart?
b. Does the process appear to be in control? Explain.
Sample Set Number of Defects A 3 B 14 C 13 E 4
Step by Step Solution
★★★★★
3.29 Rating (155 Votes )
There are 3 Steps involved in it
1 Expert Approved Answer
Step: 1 Unlock

Question Has Been Solved by an Expert!
Get step-by-step solutions from verified subject matter experts
Step: 2 Unlock
Step: 3 Unlock
Document Format (2 attachments)
635d812addf23_176244.pdf
180 KBs PDF File
635d812addf23_176244.docx
120 KBs Word File