

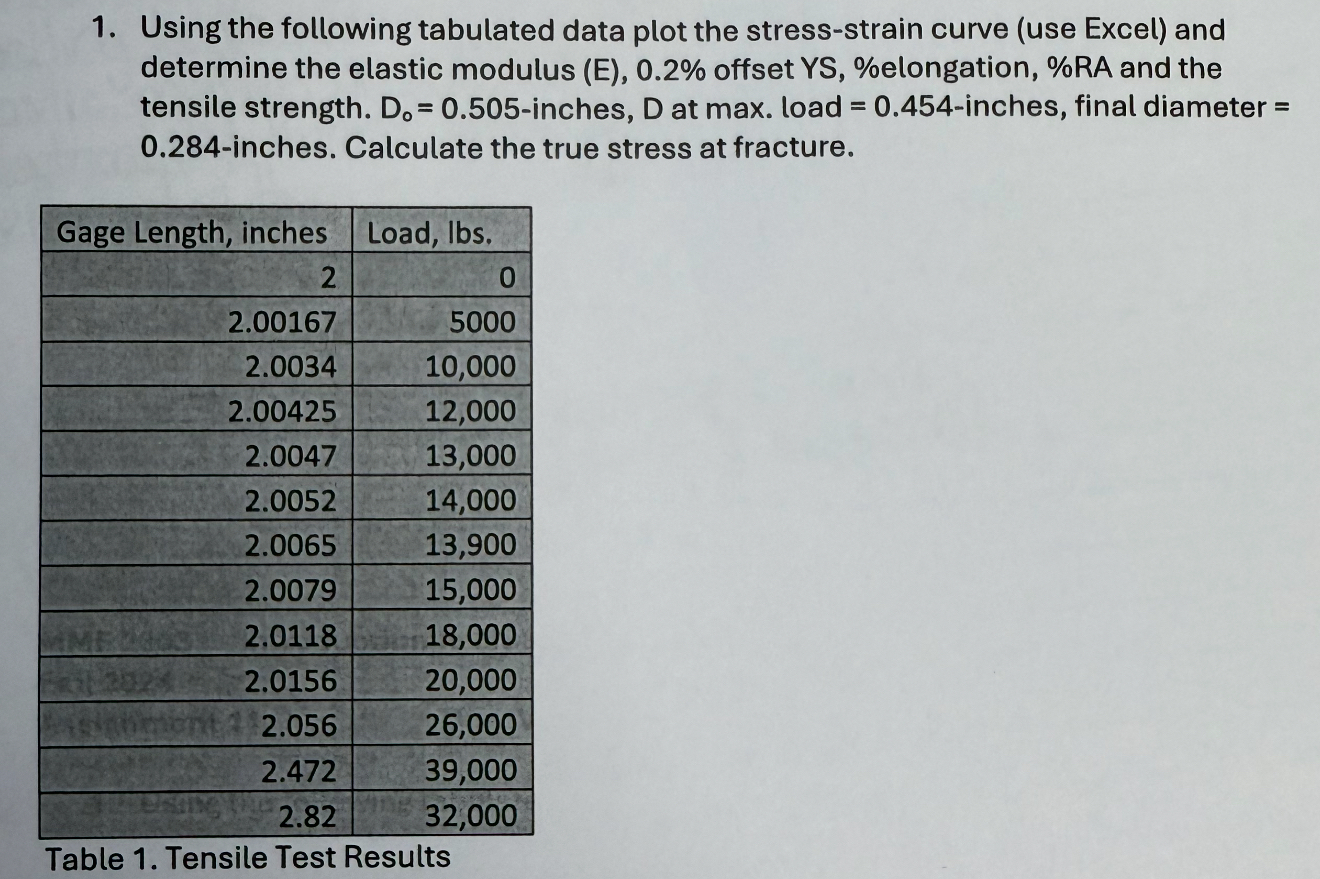
Question: Using the following tabulated data plot the stress - strain curve ( use Excel ) and determine the elastic modulus ( E ) , 0
Using the following tabulated data plot the stressstrain curve use Excel and determine the elastic modulus E offset YSelongation, RA and the tensile strength. inches, at max. load inches, final diameter inches. Calculate the true stress at fracture.
tableGage Length, inches,Load, lbs
Table Tensile Test Results
Step by Step Solution
There are 3 Steps involved in it
1 Expert Approved Answer
Step: 1 Unlock

Question Has Been Solved by an Expert!
Get step-by-step solutions from verified subject matter experts
Step: 2 Unlock
Step: 3 Unlock