

Question: Using the graph below, at what point would total expenditures be greater-point a or point b? Explain . 3 INTERPRETING GRAPHS Using the graph below,
Using the graph below, at what point would total expenditures be greater-point a or point b? Explain .
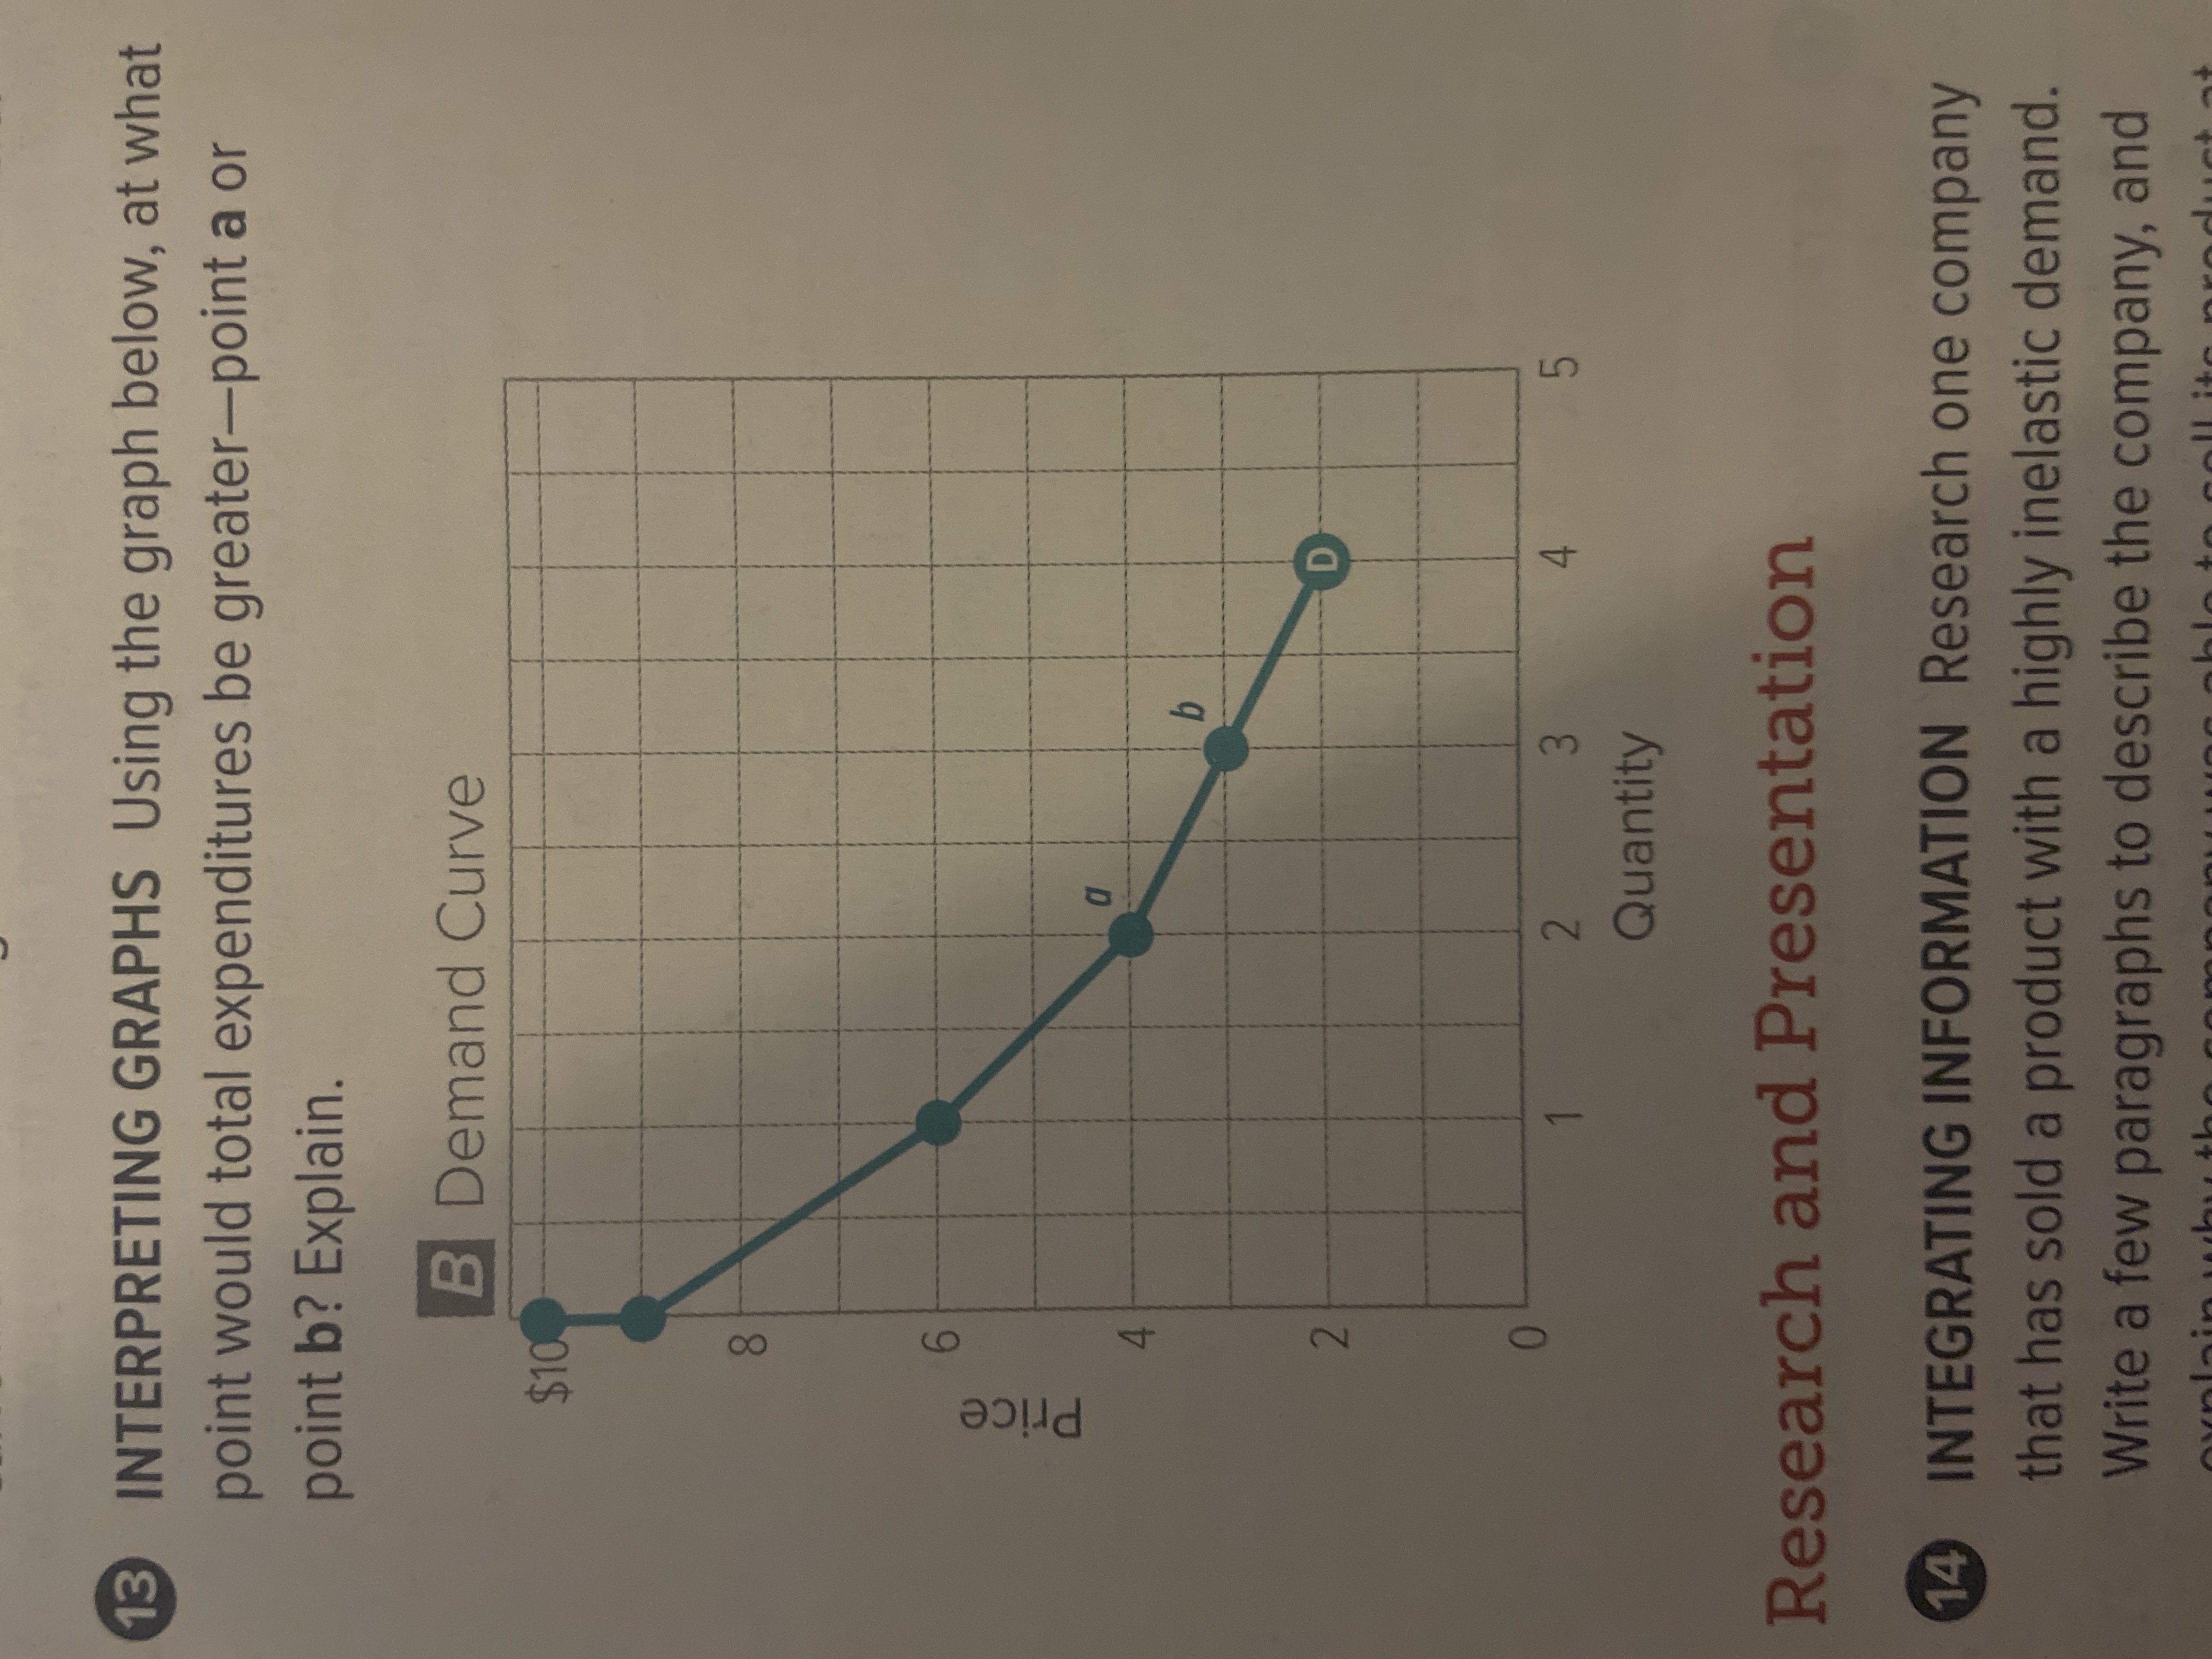
3 INTERPRETING GRAPHS Using the graph below, at what point would total expenditures be greater-point a or point b? Explain. B Demand Curve $10 8 6 Price 4 N 2 13 4 5 Quantity Research and Presentation INTEGRATING INFORMATION Research one company that has sold a product with a highly inelastic demand. Write a few paragraphs to describe the company, and
Step by Step Solution
There are 3 Steps involved in it
1 Expert Approved Answer
Step: 1 Unlock

Question Has Been Solved by an Expert!
Get step-by-step solutions from verified subject matter experts
Step: 2 Unlock
Step: 3 Unlock