

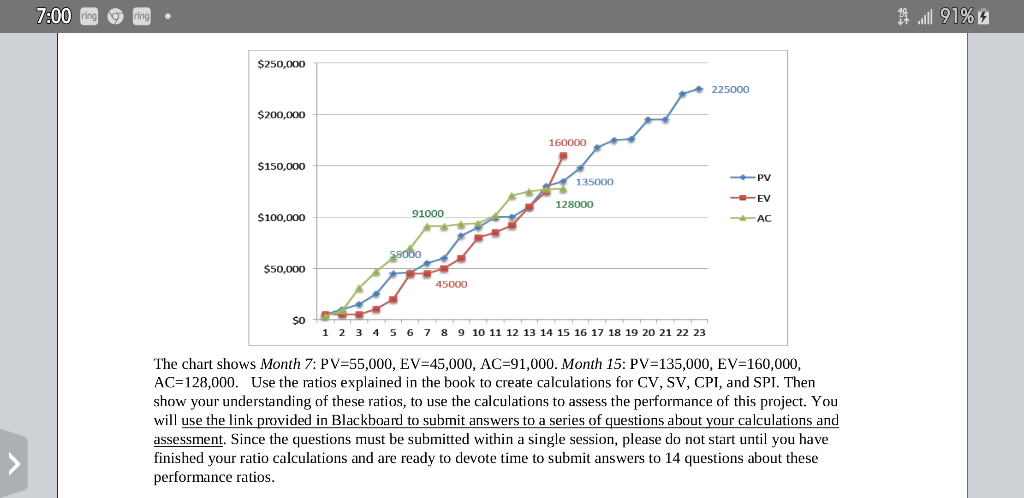
Question: Using the graph of PV, EV, and AC data provided in the syllabus, calculate CV, SV, CPI, and SPI ratios to determine the performance status
Using the graph of PV, EV, and AC data provided in the syllabus, calculate CV, SV, CPI, and SPI ratios to determine the performance status of the project for month 7 and again at month 15. You will use this link to answer questions to score your calculate and status analysis results.
Step by Step Solution
There are 3 Steps involved in it
1 Expert Approved Answer
Step: 1 Unlock

Question Has Been Solved by an Expert!
Get step-by-step solutions from verified subject matter experts
Step: 2 Unlock
Step: 3 Unlock