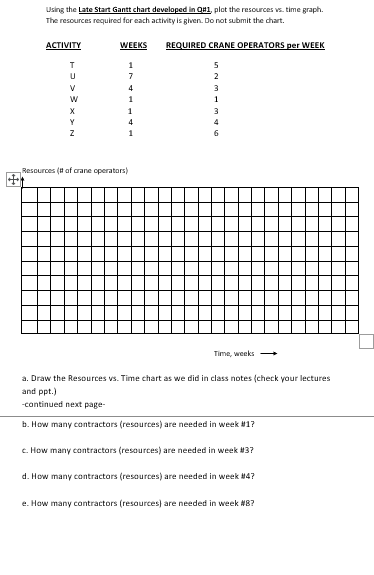
Question: Using the Late Start Gantt chart developed in QH1, plot the resources vs. time graph. The resources required for each activity is given. Do not

Using the Late Start Gantt chart developed in

Using the Late Start Gantt chart developed in QH1, plot the resources vs. time graph. The resources required for each activity is given. Do not submit the chart. ACTIVITY WEEKS REQUIRED CRANE OPERATORS per WEEK V 1 7 4 1 1 4 w 2 3 1 3 4 6 Y z 1 Resources (# of crane operators) Time, weeks - a. Draw the Resources vs. Time chart as we did in class notes (check your lectures and ppt.) -continued next page- b. How many contractors (resources) are needed in week #17 c. How many contractors (resources) are needed in week #37 d. How many contractors (resources) are needed in week #4? e. How many contractors (resources are needed in week #8

Step by Step Solution

There are 3 Steps involved in it

1 Expert Approved Answer
Step: 1 Unlock blur-text-image
Question Has Been Solved by an Expert!

Get step-by-step solutions from verified subject matter experts

Step: 2 Unlock
Step: 3 Unlock

Students Have Also Explored These Related General Management Questions!