

Question: Using the linearly separated data shown in the table below, build a support vector machine using Python in order to classify this data. What is
Using the linearly separated data shown in the table below, build a support vector machine using Python in order to classify this data. What is the equation for the decision boundary? Explai your answer.
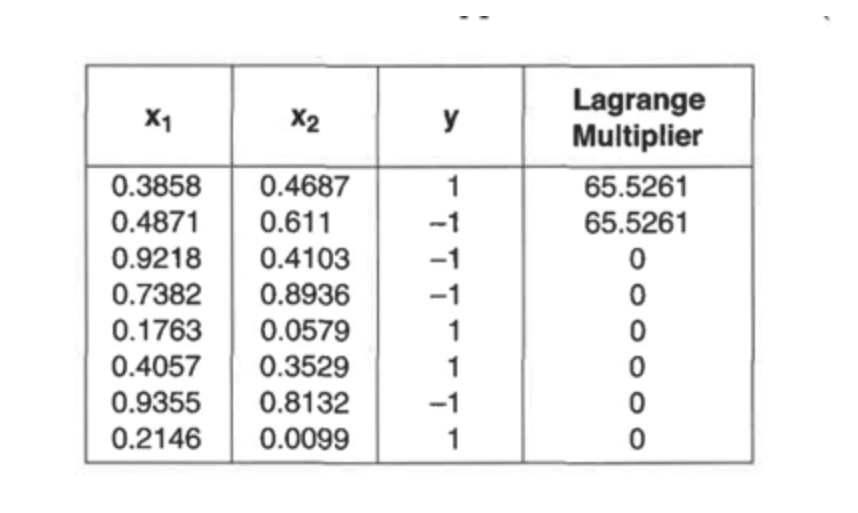
Lagrange Multiplier 65.5261 65.5261 0 0 X2 0.38580.4687 0.48710.611 0.9218 0.4103 0.7382 0.8936 0.17630.0579 0.4057 0.3529 0.9355 0.8132 0.21460.0099 0 0 Lagrange Multiplier 65.5261 65.5261 0 0 X2 0.38580.4687 0.48710.611 0.9218 0.4103 0.7382 0.8936 0.17630.0579 0.4057 0.3529 0.9355 0.8132 0.21460.0099 0 0
Step by Step Solution
There are 3 Steps involved in it
1 Expert Approved Answer
Step: 1 Unlock

Question Has Been Solved by an Expert!
Get step-by-step solutions from verified subject matter experts
Step: 2 Unlock
Step: 3 Unlock