

Question: Using the Pitching table, write a query that select the playerid, teamid, Wins (W), Loss (L) and Earned Run Average (ERA) for every player
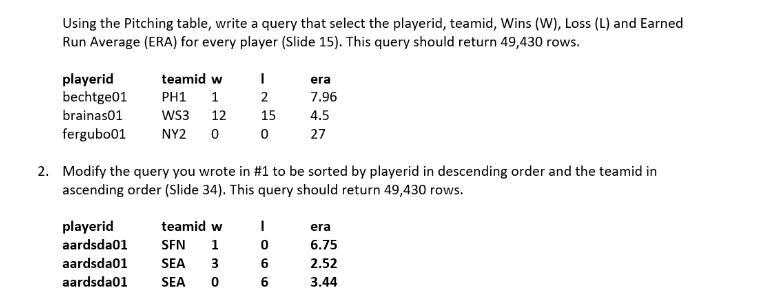
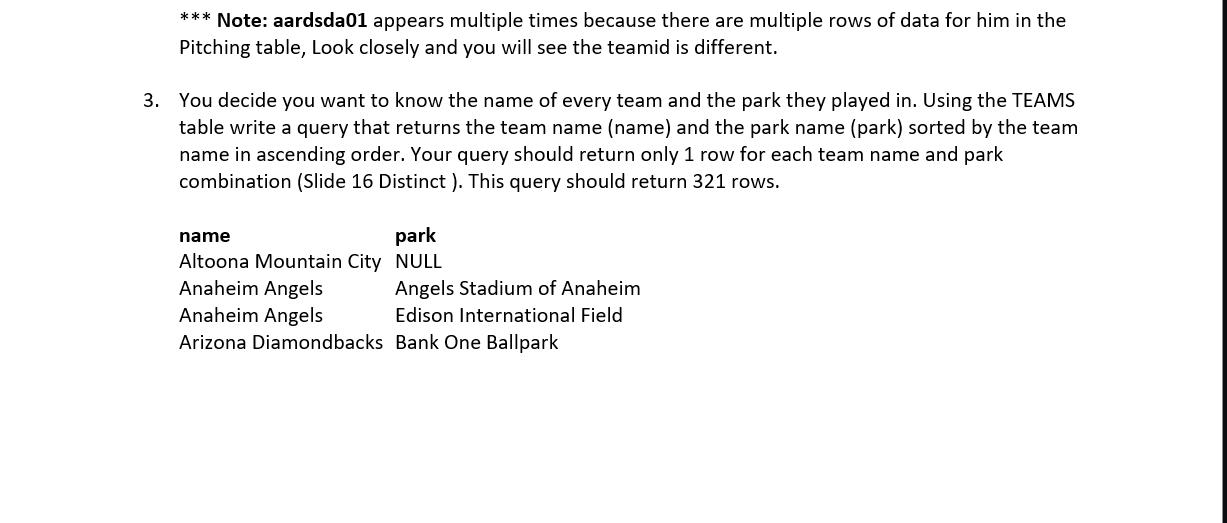
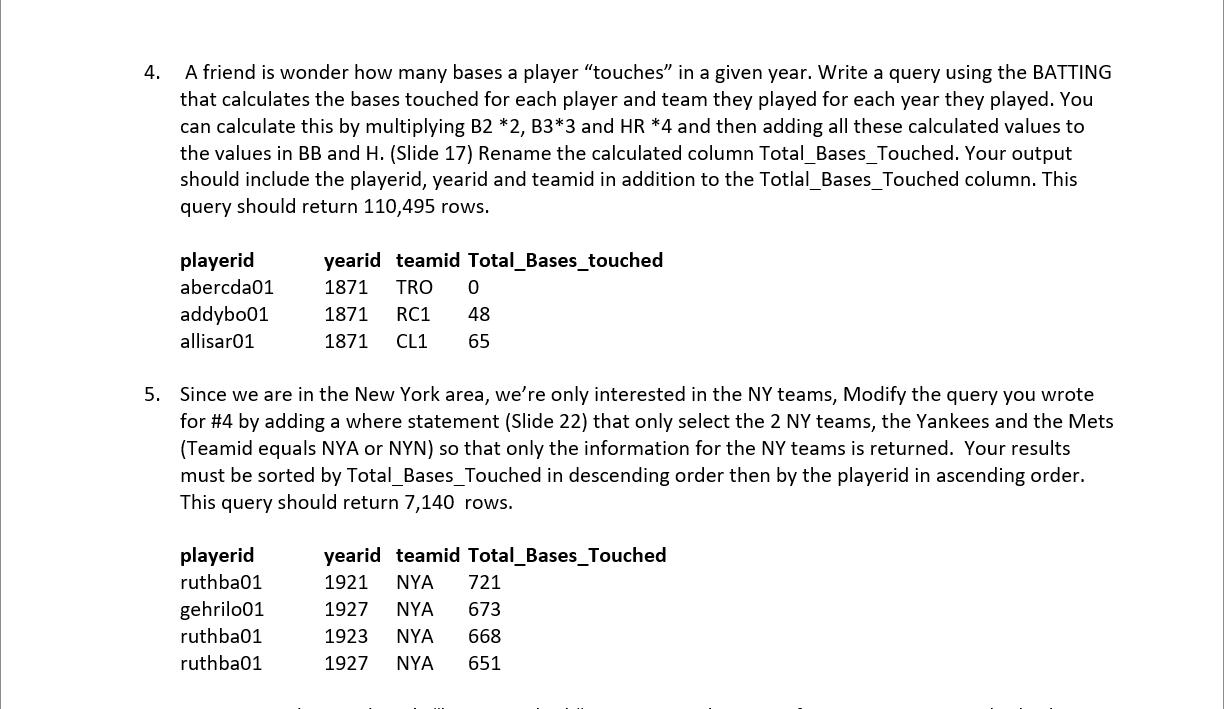
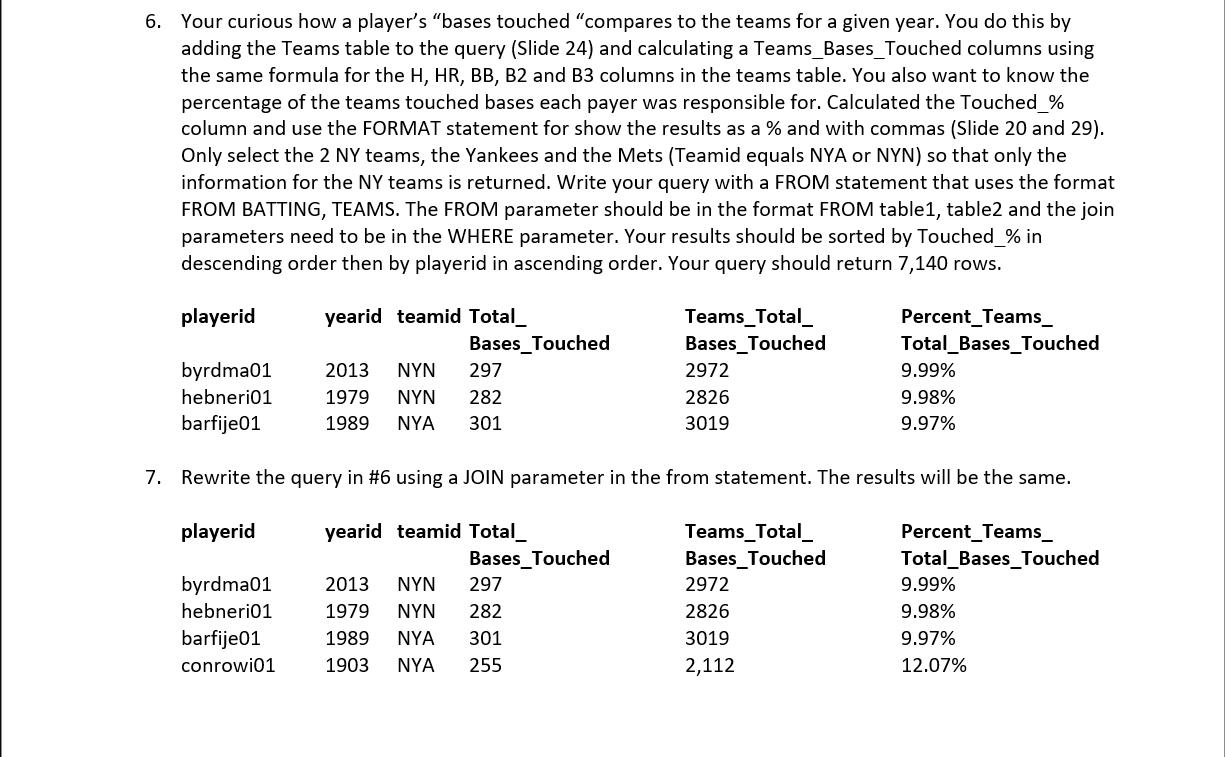
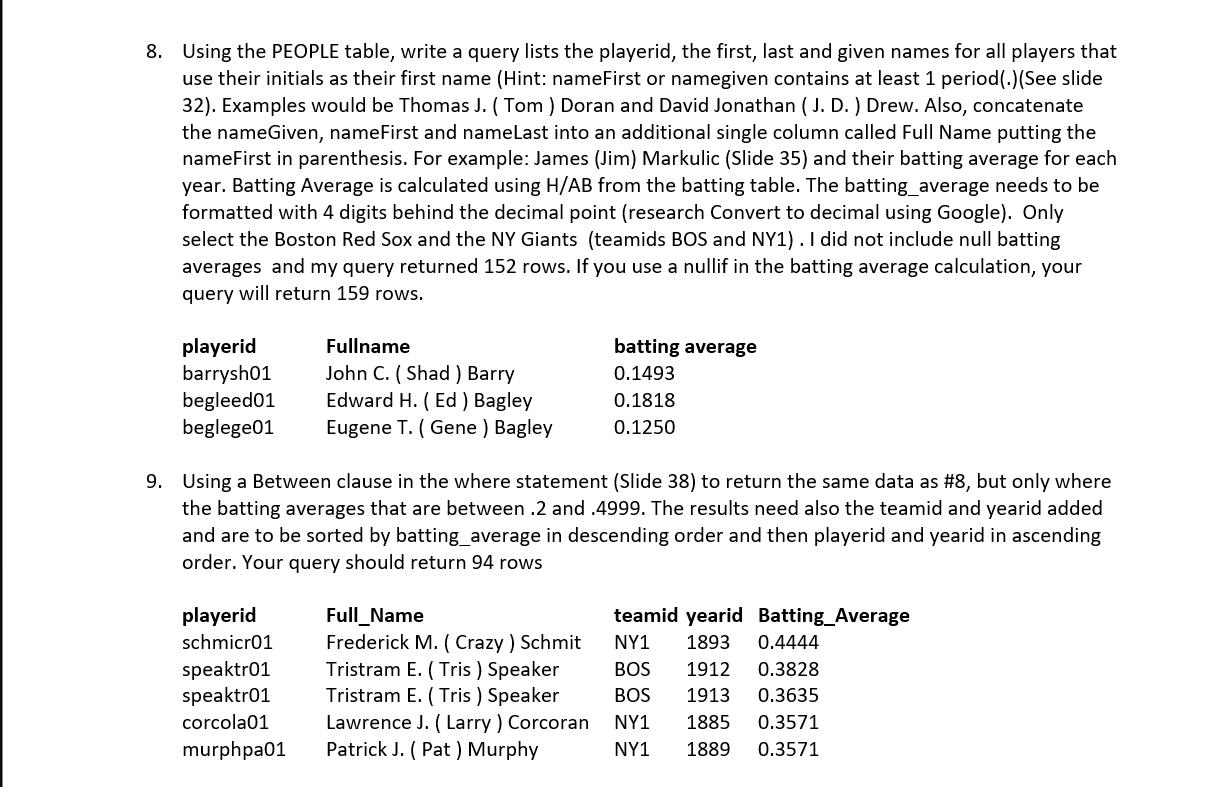
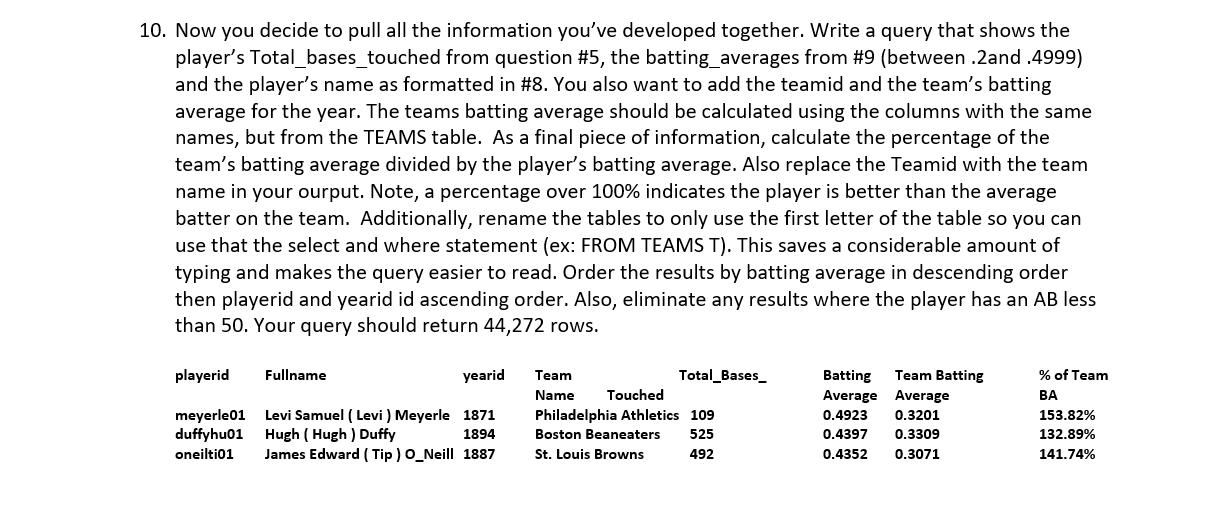
Using the Pitching table, write a query that select the playerid, teamid, Wins (W), Loss (L) and Earned Run Average (ERA) for every player (Slide 15). This query should return 49,430 rows. playerid teamid w bechtge01 PH1 1 brainas01 WS3 12 fergubo01 NY2 0 I playerid teamid w aardsda01 SFN 1 aardsda01 SEA 3 aardsda01 SEA 0 2 15 0 2. Modify the query you wrote in #1 to be sorted by playerid in descending order and the teamid in ascending order (Slide 34). This query should return 49,430 rows. I era 7.96 0 6 6 4.5 27 era 6.75 2.52 3.44 *** Note: aardsda01 appears multiple times because there are multiple rows of data for him in the Pitching table, Look closely and you will see the teamid is different. 3. You decide you want to know the name of every team and the park they played in. Using the TEAMS table write a query that returns the team name (name) and the park name (park) sorted by the team name in ascending order. Your query should return only 1 row for each team name and park combination (Slide 16 Distinct ). This query should return 321 rows. name park Altoona Mountain City NULL Anaheim Angels Anaheim Angels Arizona Diamondbacks Angels Stadium of Anaheim Edison International Field Bank One Ballpark 4. A friend is wonder how many bases a player "touches" in a given year. Write a query using the BATTING that calculates the bases touched for each player and team they played for each year they played. You can calculate this by multiplying B2 *2, B3*3 and HR *4 and then adding all these calculated values to the values in BB and H. (Slide 17) Rename the calculated column Total_Bases_Touched. Your output should include the playerid, yearid and teamid in addition to the Totlal_Bases_Touched column. This query should return 110,495 rows. playerid abercda01 addybo01 allisar01 5. Since we are in the New York area, we're only interested in the NY teams, Modify the query you wrote for #4 by adding a where statement (Slide 22) that only select the 2 NY teams, the Yankees and the Mets (Teamid equals NYA or NYN) so that only the information for the NY teams is returned. Your results must be sorted by Total_Bases_Touched in descending order then by the playerid in ascending order. This query should return 7,140 rows. playerid ruthba01 yearid teamid Total_Bases_touched 1871 TRO 0 1871 RC1 48 1871 CL1 65 gehrilo01 ruthba01 ruthba01 yearid teamid Total_Bases_Touched 1921 NYA 721 1927 NYA 673 1923 NYA 668 1927 NYA 651 6. Your curious how a player's "bases touched "compares to the teams for a given year. You do this by adding the Teams table to the query (Slide 24) and calculating a Teams_Bases_Touched columns using the same formula for the H, HR, BB, B2 and B3 columns in the teams table. You also want to know the percentage of the teams touched bases each payer was responsible for. Calculated the Touched_% column and use the FORMAT statement for show the results as a % and with commas (Slide 20 and 29). Only select the 2 NY teams, the Yankees and the Mets (Teamid equals NYA or NYN) so that only the information for the NY teams is returned. Write your query with a FROM statement that uses the format FROM BATTING, TEAMS. The FROM parameter should be in the format FROM table1, table2 and the join parameters need to be in the WHERE parameter. Your results should be sorted by Touched_% in descending order then by playerid in ascending order. Your query should return 7,140 rows. playerid yearid teamid Total_ byrdma01 2013 NYN hebneri01 barfije01 7. Rewrite the query in #6 using a JOIN parameter in the from statement. The results will be the same. playerid yearid teamid Total_ Percent_Teams_ Total_Bases Touched byrdma01 hebneri01 barfije01 conrowi01 Bases_Touched 297 1979 NYN 282 1989 NYA 301 Bases_Touched 2013 NYN 297 1979 NYN 282 1989 NYA 301 1903 NYA 255 Teams_Total_ Bases_Touched 2972 2826 3019 Teams_Total_ Bases_Touched 2972 2826 3019 2,112 Percent_Teams_ Total_Bases_Touched 9.99% 9.98% 9.97% 9.99% 9.98% 9.97% 12.07% 8. Using the PEOPLE table, write a query lists the playerid, the first, last and given names for all players that use their initials as their first name (Hint: nameFirst or namegiven contains at least 1 period(.)(See slide 32). Examples would be Thomas J. (Tom) Doran and David Jonathan (J. D.) Drew. Also, concatenate the nameGiven, nameFirst and nameLast into an additional single column called Full Name putting the nameFirst in parenthesis. For example: James (Jim) Markulic (Slide 35) and their batting average for each year. Batting Average is calculated using H/AB from the batting table. The batting_average needs to be formatted with 4 digits behind the decimal point (research Convert to decimal using Google). Only select the Boston Red Sox and the NY Giants (teamids BOS and NY1). I did not include null batting averages and my query returned 152 rows. If you use a nullif in the batting average calculation, your query will return 159 rows. playerid barrysh01 begleed01 beglege01 playerid schmicr01 Fullname John C. (Shad ) Barry Edward H. (Ed) Bagley Eugene T. (Gene) Bagley 9. Using a Between clause in the where statement (Slide 38) to return the same data as #8, but only where the batting averages that are between .2 and .4999. The results need also the teamid and yearid added and are to be sorted by batting_average in descending order and then playerid and yearid in ascending order. Your query should return 94 rows speaktr01 speaktr01 corcola01 murphpa01 batting average 0.1493 0.1818 0.1250 Full Name Frederick M. (Crazy) Schmit Tristram E. (Tris ) Speaker Tristram E. (Tris) Speaker Lawrence J. (Larry) Corcoran Patrick J. ( Pat) Murphy teamid yearid Batting_Average NY1 1893 0.4444 0.3828 BOS 1912 BOS 1913 0.3635 NY1 1885 0.3571 NY1 1889 0.3571 10. Now you decide to pull all the information you've developed together. Write a query that shows the player's Total_bases_touched from question #5, the batting_averages from #9 (between .2and .4999) and the player's name as formatted in #8. You also want to add the teamid and the team's batting average for the year. The teams batting average should be calculated using the columns with the same names, but from the TEAMS table. As a final piece of information, calculate the percentage of the team's batting average divided by the player's batting average. Also replace the Teamid with the team name in your ourput. Note, a percentage over 100% indicates the player is better than the average batter on the team. Additionally, rename the tables to only use the first letter of the table so you can use that the select and where statement (ex: FROM TEAMS T). This saves a considerable amount of typing and makes the query easier to read. Order the results by batting average in descending order then playerid and yearid id ascending order. Also, eliminate any results where the player has an AB less than 50. Your query should return 44,272 rows. playerid Fullname yearid meyerle01 Levi Samuel (Levi) Meyerle 1871 duffyhu01 Hugh (Hugh) Duffy 1894 oneilti01 James Edward (Tip) O_Neill 1887 Total_Bases_ Team Name Touched Philadelphia Athletics 109 Boston Beaneaters 525 St. Louis Browns 492 Batting Team Batting Average Average 0.3201 0.4923 0.4397 0.3309 0.4352 0.3071 % of Team BA 153.82% 132.89% 141.74%
Step by Step Solution
3.40 Rating (147 Votes )
There are 3 Steps involved in it
Answer SELECT playerID teamID W L ERA FROM Pitching This query will return ... View full answer

Get step-by-step solutions from verified subject matter experts