

Question: Using the Project Two Financial Formulas Spreadsheet and the balance sheet, income statement, and cash flow statement from Mergent Online for your chosen company, calculate
Using the Project Two Financial Formulas Spreadsheet and the balance sheet, income statement, and cash flow statement from Mergent Online for your chosen company, calculate the financial ratios for the most recent fiscal quarter. Then, compare those ratios with the same ratios for the same fiscal quarter from one year prior in Mergent. 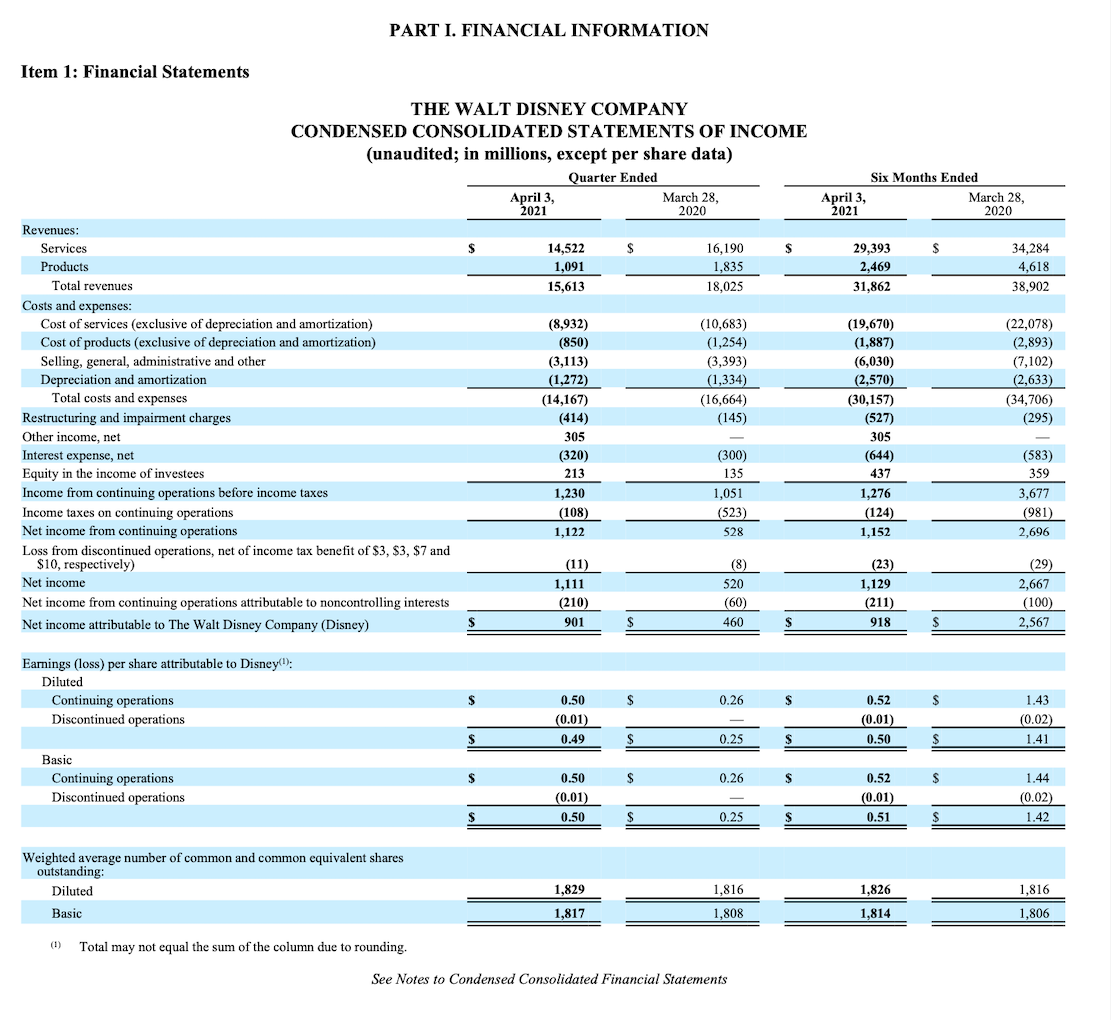
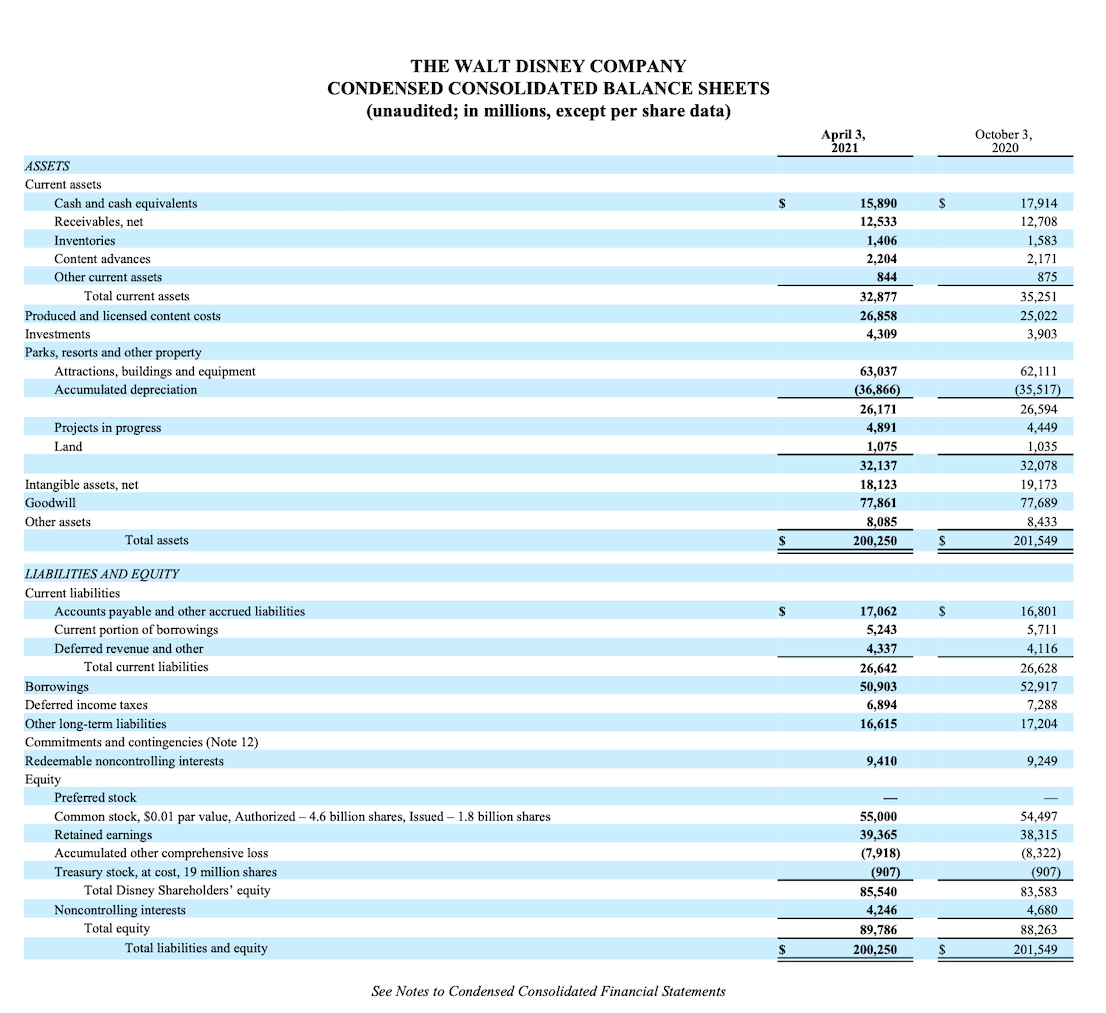
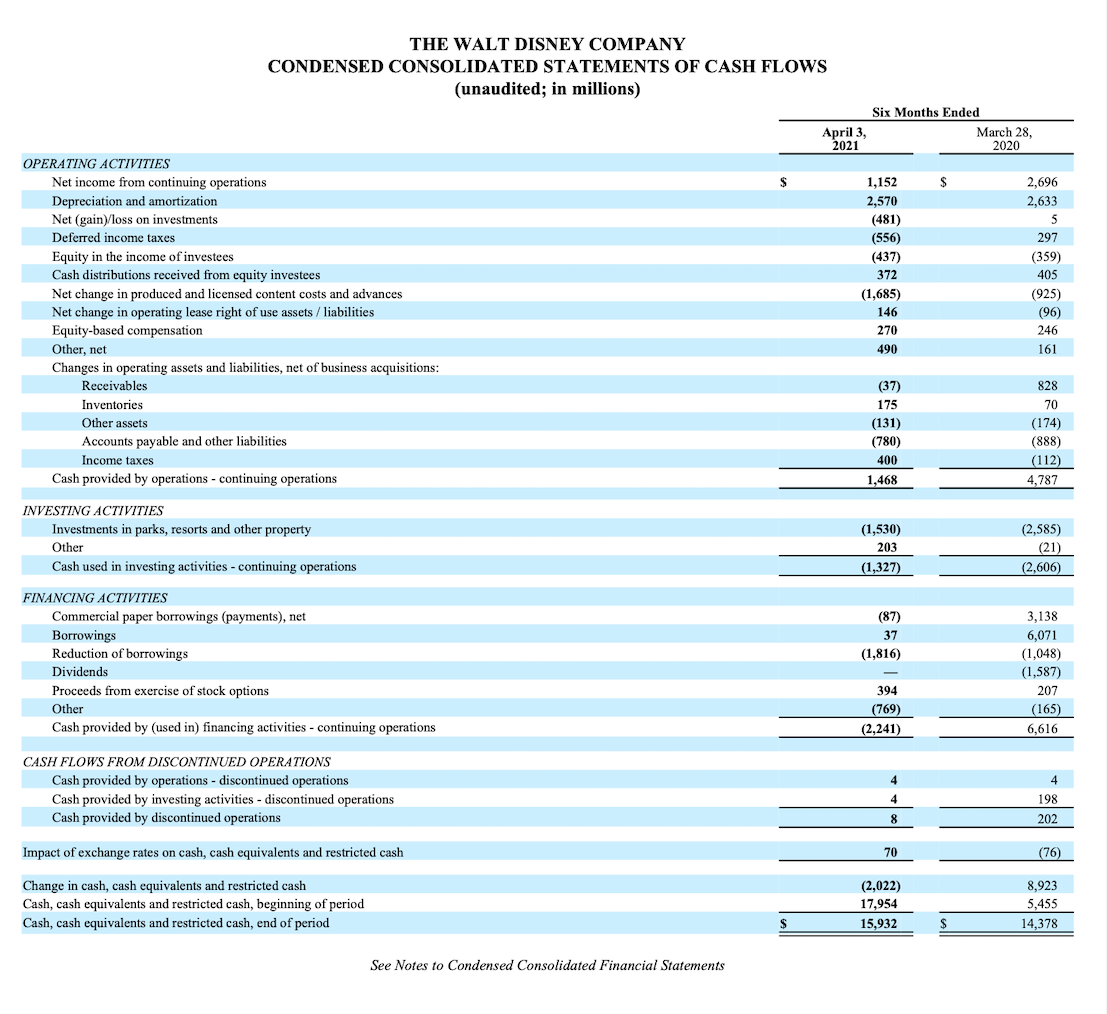
PART I. FINANCIAL INFORMATION Item 1: Financial Statements Six Months Ended April 3, March 28, 2021 2020 $ 29,393 2,469 31,862 34,284 4,618 38,902 THE WALT DISNEY COMPANY CONDENSED CONSOLIDATED STATEMENTS OF INCOME (unaudited; in millions, except per share data) Quarter Ended April 3, March 28, 2021 2020 Revenues: Services s 14,522 16,190 Products 1,091 1,835 Total revenues 15,613 18,025 Costs and expenses: Cost of services (exclusive of depreciation and amortization) (8,932) (10,683) Cost of products (exclusive of depreciation and amortization) (850) (1,254) Selling, general, administrative and other (3,113) (3,393) Depreciation and amortization (1,272) (1,334) Total costs and expenses (14,167) (16,664) Restructuring and impairment charges (414) (145) Other income, net 305 Interest expense, net (320) (300) Equity in the income of investees 213 135 Income from continuing operations before income taxes 1,230 1,051 Income taxes on continuing operations (108) (523) Net income from continuing operations 1,122 528 Loss from discontinued operations, net of income tax benefit of $3, $3, $7 and $10, respectively) (11) (8) Net income 1,111 520 Net income from continuing operations attributable to noncontrolling interests (210) (60) ) Net income attributable to The Walt Disney Company (Disney) $ 901 $ 460 S (19,670) (1,887) (6,030) (2,570) (30,157) (527) 305 (644) 437 1,276 (124) (22,078) (2,893) (7,102) (2,633) (34,706) (295) (583) 359 3,677 (981) 2,696 1,152 (23) 1,129 (211) 918 (29) 2,667 (100) 2,567 $ Earnings (loss) per share attributable to Disney(1). Diluted Continuing operations Discontinued operations S $ 0.26 S $ 0.50 (0.01) 0.49 0.52 (0.01) 0.50 1.43 (0.02) 1.41 S $ 0.25 $ S $ Basic Continuing operations Discontinued operations S $ 0.26 S $ 0.50 (0.01) 0.50 0.52 () (0.01) 0.51 1.44 (0.02) 1.42 S $ 0.25 $ $ Weighted average number of common and common equivalent shares outstanding: Diluted Basic 1,829 1,816 1,816 1,808 1,826 1,814 1,817 1,806 Total may not equal the sum of the column due to rounding. See Notes to Condensed Consolidated Financial Statements THE WALT DISNEY COMPANY CONDENSED CONSOLIDATED BALANCE SHEETS (unaudited; in millions, except per share data) April 3, 2021 October 3, 2020 15,890 S ASSETS Current assets Cash and cash equivalents Receivables, net Inventories Content advances Other current assets Total current assets Produced and licensed content costs Investments Parks, resorts and other property Attractions, buildings and equipment Accumulated depreciation 12,533 1,406 2,204 844 32,877 26,858 4,309 17,914 12,708 1,583 2,171 875 35,251 25,022 3,903 Projects in progress Land 63,037 (36,866) 26,171 4,891 1,075 32,137 18,123 77,861 8,085 200,250 62,111 (35,517 26,594 4,449 1,035 32,078 19,173 77,689 8,433 201,549 Intangible assets, net Goodwill Other assets Total assets S 17,062 5,243 4,337 26,642 50,903 6,894 16,615 16,801 5,711 4,116 26,628 52,917 7,288 17,204 LIABILITIES AND EQUITY Current liabilities Accounts payable and other accrued liabilities Current portion of borrowings Deferred revenue and other Total current liabilities Borrowings Deferred income taxes Other long-term liabilities Commitments and contingencies (Note 12) Redeemable noncontrolling interests Equity Preferred stock Common stock, $0.01 par value, Authorized - 4.6 billion shares, Issued - 1.8 billion shares Retained earnings Accumulated other comprehensive loss Treasury stock, at cost, 19 million shares Total Disney Shareholders' equity Noncontrolling interests Total equity Total liabilities and equity 9,410 9,249 55,000 39,365 (7,918) (907) 85,540 4,246 89,786 200,250 54,497 38,315 (8,322) (907) 83,583 4,680 88,263 201,549 S S See Notes to Condensed Consolidated Financial Statements THE WALT DISNEY COMPANY CONDENSED CONSOLIDATED STATEMENTS OF CASH FLOWS (unaudited; in millions) April 3, 2021 Six Months Ended March 28, 2020 S 2,696 2,633 5 297 (359) OPERATING ACTIVITIES Net income from continuing operations Depreciation and amortization Net (gain)/loss on investments Deferred income taxes Equity in the income of investees Cash distributions received from equity investees Net change in produced and licensed content costs and advances Net change in operating lease right of use assets/ liabilities Equity-based compensation Other, net Changes in operating assets and liabilities, net of business acquisitions: Receivables Inventories Other assets Accounts payable and other liabilities Income taxes Cash provided by operations - continuing operations 405 (925) (96) 246 161 SEEEEEGELE BIEDT ga sagrada 828 70 (174) (888) (112) 4,787 INVESTING ACTIVITIES Investments in parks, resorts and other property Other Cash used in investing activities - continuing operations (2,585) (21) (2,606) FINANCING ACTIVITIES Commercial paper borrowings (payments), net Borrowings Reduction of borrowings Dividends Proceeds from exercise of stock options Other Cash provided by (used in) financing activities - continuing operations 3,138 6,071 (1,048) (1,587) 207 (165) 6,616 4 CASH FLOWS FROM DISCONTINUED OPERATIONS Cash provided by operations - discontinued operations Cash provided by investing activities - discontinued operations Cash provided by discontinued operations 4 198 202 8 Impact of exchange rates on cash, cash equivalents and restricted cash 70 (76) 8,923 Change in cash, cash equivalents and restricted cash Cash, cash equivalents and restricted cash, beginning of period Cash, cash equivalents and restricted cash, end of period (2,022) 17,954 15,932 5,455 S 14,378 See Notes to Condensed Consolidated Financial Statements A B D E M N O 1 9 12 Month Interest Investment Valuel $0 $0| $0 0 $0 10 $0 $0. 11 $0 $ $0 $0 $0 Month Interest Investment Value 1 $0 $0 9 $0 $0 $0 10 $0 $0 11 $0 $0 12 $0 $0 1 Month Interest Investment Value $0 $0 9 $0 $0 10 $0 $0 11 $0 $0 12 $0 $ $0 1 Month Interest Investment Value $0 $0 9 $0 $ol 10 $0 $0 11 $0 $0 12 $0 $0 1 Month Interest Investment Value $0 $0 F G H I JK L L Time Value of Money - Monthly Compounding Year 1 2 3 4 5 6 7 8 $0 $0 $0 $0 $0 $0 $0 0 $0 $0 $0 $0 $0 $ $0 $0 Year 2 2 3 4 5 6 7 8 $0 $0 $0 $0 $ $0 $0 $0 $0 $o $0 $0 $0 $0 $0 $0 $0 Year 3 2 3 4 5 6 7 8 $0 $0 $0 $0 $0 $0 $0 $0 ol $0 $0 $0 $0 $0 $0 Year 4 2 3 4 5 6 7 8 $0) $0 $0 $0 $0 $0 $0 $0 $ $0 $0 $0 $0 $0 $0 $0 $0 $0 Year 5 2 3 4 5 6 7 7 8 8 $0 $0 $0 $0 $0 $0 $0 $0 $0 $0 $0 $0 $0 $0 Year 6 2 3 3 4 5 6 7 8 $0 $0 $0 $0 $0 $0 $0 $0 $0 $0 $0 $0 $0 $0 Year 7 2 3 4 5 6 7 8 $0 $0 $0 $0 $0 $0 $0 $0 $0 $0 $0 so|| $ $0 $0 Year 8 2 3 4 5 6 6 7 8 $0 $0 0 $0 $0 $0 $0 $0 $0 $0 $0 $0 $0 $0 $0 Year 9 2 3 4 5 6 7 8 $0 $0 $0 $0 $0 $0 $0 $0 $0 $0 $0 $0 $0 $0 Year 10 2 3 4 5 5 6 7 8 $0 $0 $0 $0 $0 $0 $0 $0 $0 $0 $0 $0 $0 $0 9 9 0 $0 $0 10 $0 $0 11 $0 $0 1 2 Rate of Return 3 Initial Investment 4 5 6 7 8 9 10 11 12 13 14 15 16 17 18 19 20 21 22 23 24 25 26 27 28 29 30 31 32 33 34 35 36 37 38 39 40 41 42 43 44 RATIOS 12 $0 $0 1 Month Interest Investment Value $0 $0| 9 $0 $0 10 $0 $0 11 $0 $0 12 $0 $0 1 Month Interest Investment Value $0 $0 9 $0 $0 $0 10 $0 $0 11 $0 $0 12 $0 $0 1 1 9 Month Interest Investment Value $0 $0 $0 $0 10 $0 $ol 11 $0 $0 12 $0 $0 1 12 Month Interest Investment Value $0 $0 9 $0 $0 $ 10 $0 $0 11 $0 0 $0 $0 $0 1 Month Interest Investment Value $0 $0 9 $0 $0 10 $0 $0 11 $0 $0 12 $0 $0 Monthly Annual PV FV PV - Lump Sum FV - Lump Sum NPV + Ready A B D E L M N O 4 1 Year 1 F. G H I J Time Value of Money - Annual Compounding 2 3 4 5 6 7 $0 $0 $0 $0 $0 $0 $0 $0 $0 $0 $0 $0 2 Rate of Return 3 Initial Investment 10 Interest Investment Value $0 $0 8 $0 $0 9 $0 $0 $0 $0 081 4 5 6 7 8 9 A1 x fx Time Value of Money - Present Value E B C D 1 Time Value of Money - Present Value Annuity 2 Number of Years 3 Rate of Return $0.00 4. Payment 5 6 7 PART I. FINANCIAL INFORMATION Item 1: Financial Statements Six Months Ended April 3, March 28, 2021 2020 $ 29,393 2,469 31,862 34,284 4,618 38,902 THE WALT DISNEY COMPANY CONDENSED CONSOLIDATED STATEMENTS OF INCOME (unaudited; in millions, except per share data) Quarter Ended April 3, March 28, 2021 2020 Revenues: Services s 14,522 16,190 Products 1,091 1,835 Total revenues 15,613 18,025 Costs and expenses: Cost of services (exclusive of depreciation and amortization) (8,932) (10,683) Cost of products (exclusive of depreciation and amortization) (850) (1,254) Selling, general, administrative and other (3,113) (3,393) Depreciation and amortization (1,272) (1,334) Total costs and expenses (14,167) (16,664) Restructuring and impairment charges (414) (145) Other income, net 305 Interest expense, net (320) (300) Equity in the income of investees 213 135 Income from continuing operations before income taxes 1,230 1,051 Income taxes on continuing operations (108) (523) Net income from continuing operations 1,122 528 Loss from discontinued operations, net of income tax benefit of $3, $3, $7 and $10, respectively) (11) (8) Net income 1,111 520 Net income from continuing operations attributable to noncontrolling interests (210) (60) ) Net income attributable to The Walt Disney Company (Disney) $ 901 $ 460 S (19,670) (1,887) (6,030) (2,570) (30,157) (527) 305 (644) 437 1,276 (124) (22,078) (2,893) (7,102) (2,633) (34,706) (295) (583) 359 3,677 (981) 2,696 1,152 (23) 1,129 (211) 918 (29) 2,667 (100) 2,567 $ Earnings (loss) per share attributable to Disney(1). Diluted Continuing operations Discontinued operations S $ 0.26 S $ 0.50 (0.01) 0.49 0.52 (0.01) 0.50 1.43 (0.02) 1.41 S $ 0.25 $ S $ Basic Continuing operations Discontinued operations S $ 0.26 S $ 0.50 (0.01) 0.50 0.52 () (0.01) 0.51 1.44 (0.02) 1.42 S $ 0.25 $ $ Weighted average number of common and common equivalent shares outstanding: Diluted Basic 1,829 1,816 1,816 1,808 1,826 1,814 1,817 1,806 Total may not equal the sum of the column due to rounding. See Notes to Condensed Consolidated Financial Statements THE WALT DISNEY COMPANY CONDENSED CONSOLIDATED BALANCE SHEETS (unaudited; in millions, except per share data) April 3, 2021 October 3, 2020 15,890 S ASSETS Current assets Cash and cash equivalents Receivables, net Inventories Content advances Other current assets Total current assets Produced and licensed content costs Investments Parks, resorts and other property Attractions, buildings and equipment Accumulated depreciation 12,533 1,406 2,204 844 32,877 26,858 4,309 17,914 12,708 1,583 2,171 875 35,251 25,022 3,903 Projects in progress Land 63,037 (36,866) 26,171 4,891 1,075 32,137 18,123 77,861 8,085 200,250 62,111 (35,517 26,594 4,449 1,035 32,078 19,173 77,689 8,433 201,549 Intangible assets, net Goodwill Other assets Total assets S 17,062 5,243 4,337 26,642 50,903 6,894 16,615 16,801 5,711 4,116 26,628 52,917 7,288 17,204 LIABILITIES AND EQUITY Current liabilities Accounts payable and other accrued liabilities Current portion of borrowings Deferred revenue and other Total current liabilities Borrowings Deferred income taxes Other long-term liabilities Commitments and contingencies (Note 12) Redeemable noncontrolling interests Equity Preferred stock Common stock, $0.01 par value, Authorized - 4.6 billion shares, Issued - 1.8 billion shares Retained earnings Accumulated other comprehensive loss Treasury stock, at cost, 19 million shares Total Disney Shareholders' equity Noncontrolling interests Total equity Total liabilities and equity 9,410 9,249 55,000 39,365 (7,918) (907) 85,540 4,246 89,786 200,250 54,497 38,315 (8,322) (907) 83,583 4,680 88,263 201,549 S S See Notes to Condensed Consolidated Financial Statements THE WALT DISNEY COMPANY CONDENSED CONSOLIDATED STATEMENTS OF CASH FLOWS (unaudited; in millions) April 3, 2021 Six Months Ended March 28, 2020 S 2,696 2,633 5 297 (359) OPERATING ACTIVITIES Net income from continuing operations Depreciation and amortization Net (gain)/loss on investments Deferred income taxes Equity in the income of investees Cash distributions received from equity investees Net change in produced and licensed content costs and advances Net change in operating lease right of use assets/ liabilities Equity-based compensation Other, net Changes in operating assets and liabilities, net of business acquisitions: Receivables Inventories Other assets Accounts payable and other liabilities Income taxes Cash provided by operations - continuing operations 405 (925) (96) 246 161 SEEEEEGELE BIEDT ga sagrada 828 70 (174) (888) (112) 4,787 INVESTING ACTIVITIES Investments in parks, resorts and other property Other Cash used in investing activities - continuing operations (2,585) (21) (2,606) FINANCING ACTIVITIES Commercial paper borrowings (payments), net Borrowings Reduction of borrowings Dividends Proceeds from exercise of stock options Other Cash provided by (used in) financing activities - continuing operations 3,138 6,071 (1,048) (1,587) 207 (165) 6,616 4 CASH FLOWS FROM DISCONTINUED OPERATIONS Cash provided by operations - discontinued operations Cash provided by investing activities - discontinued operations Cash provided by discontinued operations 4 198 202 8 Impact of exchange rates on cash, cash equivalents and restricted cash 70 (76) 8,923 Change in cash, cash equivalents and restricted cash Cash, cash equivalents and restricted cash, beginning of period Cash, cash equivalents and restricted cash, end of period (2,022) 17,954 15,932 5,455 S 14,378 See Notes to Condensed Consolidated Financial Statements A B D E M N O 1 9 12 Month Interest Investment Valuel $0 $0| $0 0 $0 10 $0 $0. 11 $0 $ $0 $0 $0 Month Interest Investment Value 1 $0 $0 9 $0 $0 $0 10 $0 $0 11 $0 $0 12 $0 $0 1 Month Interest Investment Value $0 $0 9 $0 $0 10 $0 $0 11 $0 $0 12 $0 $ $0 1 Month Interest Investment Value $0 $0 9 $0 $ol 10 $0 $0 11 $0 $0 12 $0 $0 1 Month Interest Investment Value $0 $0 F G H I JK L L Time Value of Money - Monthly Compounding Year 1 2 3 4 5 6 7 8 $0 $0 $0 $0 $0 $0 $0 0 $0 $0 $0 $0 $0 $ $0 $0 Year 2 2 3 4 5 6 7 8 $0 $0 $0 $0 $ $0 $0 $0 $0 $o $0 $0 $0 $0 $0 $0 $0 Year 3 2 3 4 5 6 7 8 $0 $0 $0 $0 $0 $0 $0 $0 ol $0 $0 $0 $0 $0 $0 Year 4 2 3 4 5 6 7 8 $0) $0 $0 $0 $0 $0 $0 $0 $ $0 $0 $0 $0 $0 $0 $0 $0 $0 Year 5 2 3 4 5 6 7 7 8 8 $0 $0 $0 $0 $0 $0 $0 $0 $0 $0 $0 $0 $0 $0 Year 6 2 3 3 4 5 6 7 8 $0 $0 $0 $0 $0 $0 $0 $0 $0 $0 $0 $0 $0 $0 Year 7 2 3 4 5 6 7 8 $0 $0 $0 $0 $0 $0 $0 $0 $0 $0 $0 so|| $ $0 $0 Year 8 2 3 4 5 6 6 7 8 $0 $0 0 $0 $0 $0 $0 $0 $0 $0 $0 $0 $0 $0 $0 Year 9 2 3 4 5 6 7 8 $0 $0 $0 $0 $0 $0 $0 $0 $0 $0 $0 $0 $0 $0 Year 10 2 3 4 5 5 6 7 8 $0 $0 $0 $0 $0 $0 $0 $0 $0 $0 $0 $0 $0 $0 9 9 0 $0 $0 10 $0 $0 11 $0 $0 1 2 Rate of Return 3 Initial Investment 4 5 6 7 8 9 10 11 12 13 14 15 16 17 18 19 20 21 22 23 24 25 26 27 28 29 30 31 32 33 34 35 36 37 38 39 40 41 42 43 44 RATIOS 12 $0 $0 1 Month Interest Investment Value $0 $0| 9 $0 $0 10 $0 $0 11 $0 $0 12 $0 $0 1 Month Interest Investment Value $0 $0 9 $0 $0 $0 10 $0 $0 11 $0 $0 12 $0 $0 1 1 9 Month Interest Investment Value $0 $0 $0 $0 10 $0 $ol 11 $0 $0 12 $0 $0 1 12 Month Interest Investment Value $0 $0 9 $0 $0 $ 10 $0 $0 11 $0 0 $0 $0 $0 1 Month Interest Investment Value $0 $0 9 $0 $0 10 $0 $0 11 $0 $0 12 $0 $0 Monthly Annual PV FV PV - Lump Sum FV - Lump Sum NPV + Ready A B D E L M N O 4 1 Year 1 F. G H I J Time Value of Money - Annual Compounding 2 3 4 5 6 7 $0 $0 $0 $0 $0 $0 $0 $0 $0 $0 $0 $0 2 Rate of Return 3 Initial Investment 10 Interest Investment Value $0 $0 8 $0 $0 9 $0 $0 $0 $0 081 4 5 6 7 8 9 A1 x fx Time Value of Money - Present Value E B C D 1 Time Value of Money - Present Value Annuity 2 Number of Years 3 Rate of Return $0.00 4. Payment 5 6 7
Step by Step Solution
There are 3 Steps involved in it

Get step-by-step solutions from verified subject matter experts