

Question: Using the Solver add-in in Microsoft Excel, the Supply Chain Analytics Case Study Template, run a linear optimization analysis to determine the optimal number of
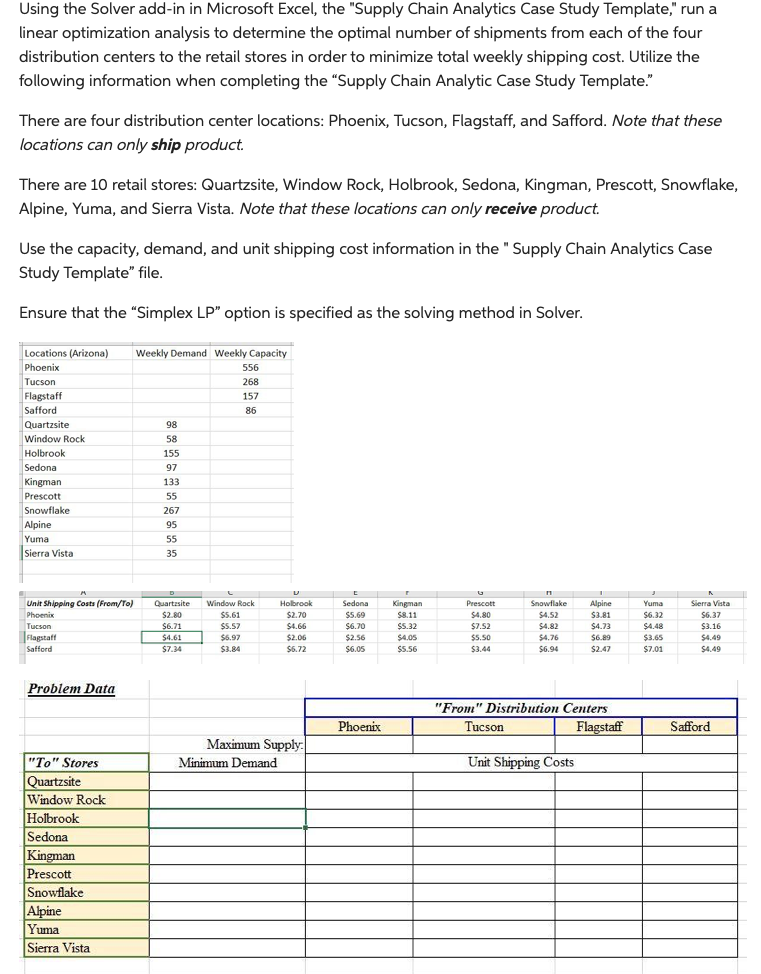
Using the Solver add-in in Microsoft Excel, the "Supply Chain Analytics Case Study Template," run a linear optimization analysis to determine the optimal number of shipments from each of the four distribution centers to the retail stores in order to minimize total weekly shipping cost. Utilize the following information when completing the "Supply Chain Analytic Case Study Template." There are four distribution center locations: Phoenix, Tucson, Flagstaff, and Safford. Note that these locations can only ship product. There are 10 retail stores: Quartzsite, Window Rock, Holbrook, Sedona, Kingman, Prescott, Snowflake, Alpine, Yuma, and Sierra Vista. Note that these locations can only receive product. Use the capacity, demand, and unit shipping cost information in the "Supply Chain Analytics Case Study Template" file. Ensure that the "Simplex LP" option is specified as the solving method in Solver
Step by Step Solution
There are 3 Steps involved in it

Get step-by-step solutions from verified subject matter experts