

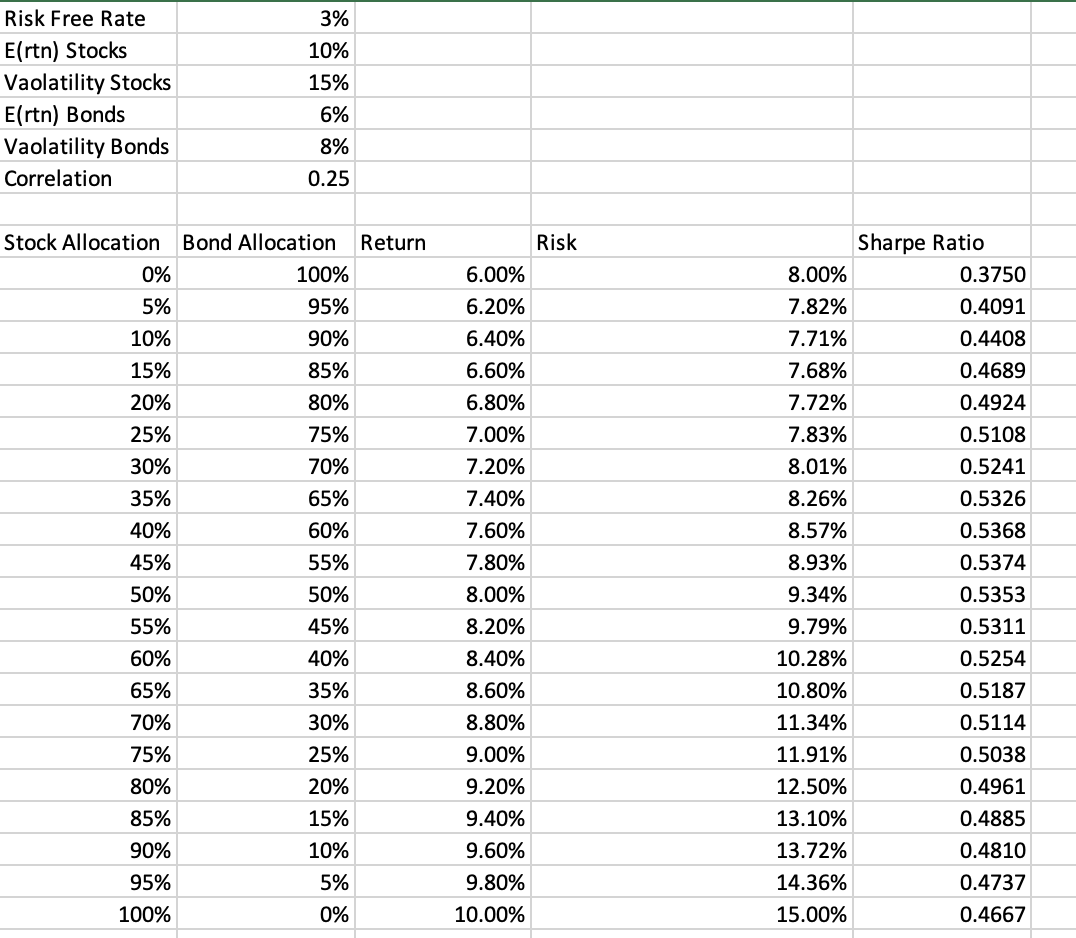
Question: Using the table created below, plot the opportunity set of risky assets in Excel. Then vary the correlation between stocks and bonds from + 1
Using the table created below, plot the opportunity set of risky assets in Excel.
Then vary the correlation between stocks and bonds from + 1 to -1 and describe the changes in shape of the efficient frontier as you do so.
Upload the Excel file that contains the table & graph.
Make sure to include in the Excel file submission, a description of the efficient frontier's shape as you vary the correlation.
Step by Step Solution
There are 3 Steps involved in it
1 Expert Approved Answer
Step: 1 Unlock

Question Has Been Solved by an Expert!
Get step-by-step solutions from verified subject matter experts
Step: 2 Unlock
Step: 3 Unlock