

Question: Using the table created in the previous problem above, plot the opportunity set of risky assets in Excel. Then vary the correlation between stocks and
Using the table created in the previous problem above, plot the opportunity set of risky assets in Excel.
Then vary the correlation between stocks and bonds from + 1 to -1 and describe the changes in shape of the efficient frontier as you do so.
Upload the Excel file that contains the table & graph.
Make sure to include in the Excel file submission, a description of the efficient frontier's shape as you vary the correlation.
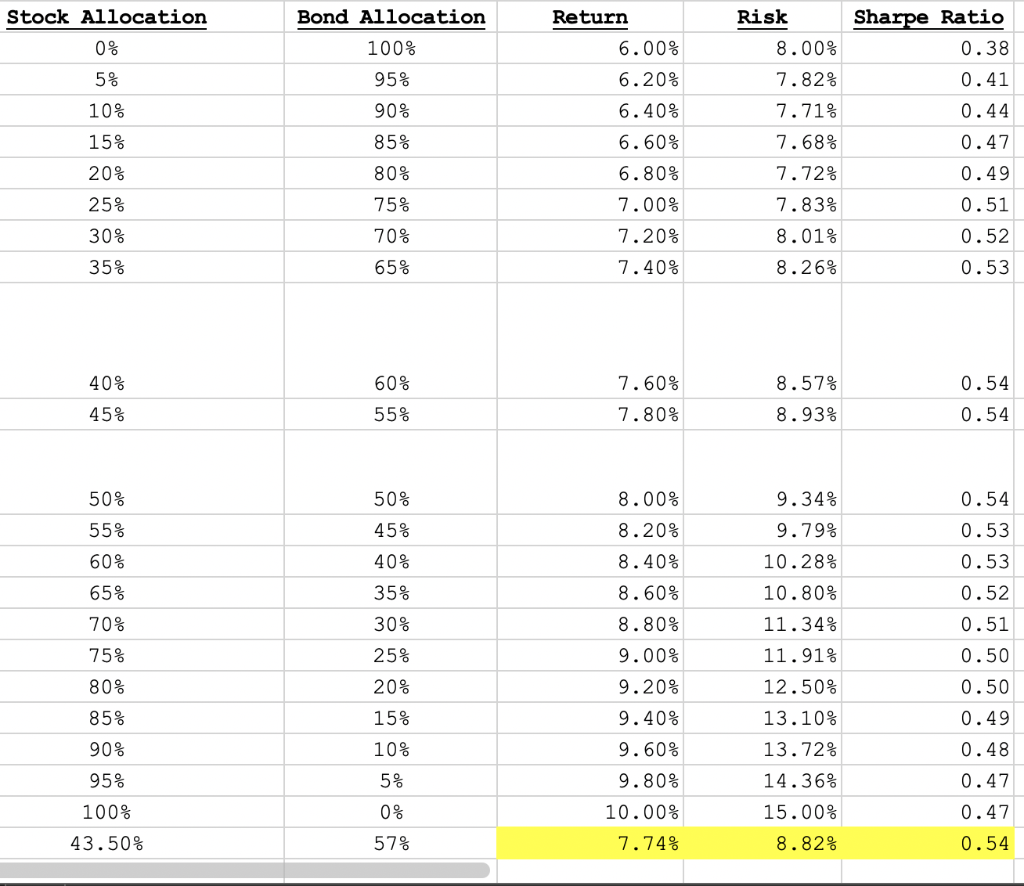
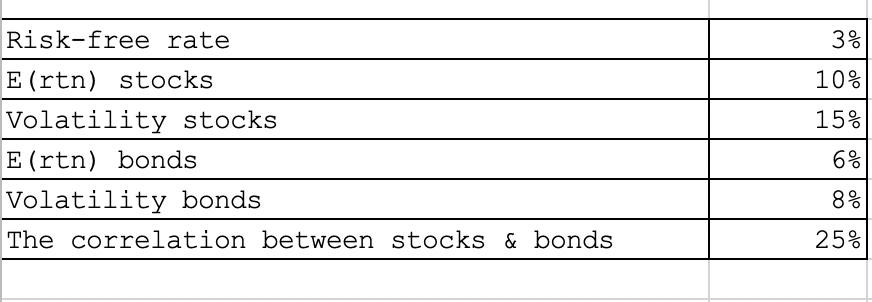
Stock Allocation 0 % 5% Bond Allocation 100% 95% 90% 10% Risk 8.00% 7.82% 7.71% 7.68% 7.72% 7.83% 15% Return 6.00% 6.20% 6.40% 6.60% 6.80% 7.00% 7.20% 7.40% 85% Sharpe Ratio 0.38 0.41 0.44 0.47 0.49 0.51 0.52 0.53 80% 20% 25% 75% 30% 70% 8.01% 8.26% 35% 65% 40% 60% 7.60% 8.57% 8.93% 0.54 0.54 45% 55% 7.80% 50% 55% 50% 45% 0.54 0.53 0.53 0.52 60% 40% 65% 35% 70% 30% 0.51 75% 25% 8.00% 8.20% 8.40% 8.60% 8.80% 9.00% 9.20% 9.40% 9.60% 9.80% 10.00% 7.74% 9.34% 9.79% 10.28% 10.80% 11.34% 11.91% 12.50% 13.10% 13.72% 14.36% 15.00% 8.82% 0.50 0.50 80% 20% 85% 15% 10% 5% 90% 95% 100% 43.50% 0.49 0.48 0.47 0.47 0.54 0% 57% Risk-free rate 3 olo 10% 15% E(rtn) stocks Volatility stocks E (rtn) bonds Volatility bonds The correlation between stocks & bonds 6% 8 olo 25% Stock Allocation 0 % 5% Bond Allocation 100% 95% 90% 10% Risk 8.00% 7.82% 7.71% 7.68% 7.72% 7.83% 15% Return 6.00% 6.20% 6.40% 6.60% 6.80% 7.00% 7.20% 7.40% 85% Sharpe Ratio 0.38 0.41 0.44 0.47 0.49 0.51 0.52 0.53 80% 20% 25% 75% 30% 70% 8.01% 8.26% 35% 65% 40% 60% 7.60% 8.57% 8.93% 0.54 0.54 45% 55% 7.80% 50% 55% 50% 45% 0.54 0.53 0.53 0.52 60% 40% 65% 35% 70% 30% 0.51 75% 25% 8.00% 8.20% 8.40% 8.60% 8.80% 9.00% 9.20% 9.40% 9.60% 9.80% 10.00% 7.74% 9.34% 9.79% 10.28% 10.80% 11.34% 11.91% 12.50% 13.10% 13.72% 14.36% 15.00% 8.82% 0.50 0.50 80% 20% 85% 15% 10% 5% 90% 95% 100% 43.50% 0.49 0.48 0.47 0.47 0.54 0% 57% Risk-free rate 3 olo 10% 15% E(rtn) stocks Volatility stocks E (rtn) bonds Volatility bonds The correlation between stocks & bonds 6% 8 olo 25%
Step by Step Solution
There are 3 Steps involved in it

Get step-by-step solutions from verified subject matter experts