

Question: Using the trend adjusted model above, with the alpha and beta values given, develop a forecast for period 28. Using the data in the model,
- Using the trend adjusted model above, with the alpha and beta values given, develop a forecast for period 28.
- Using the data in the model, develop a five period moving average for period 26.
- Using the data in the model, develop a forecast for period 27 using a weighted moving average model with weights of 0.3, 0.4, 0.2, 0.1 (with the first weight on the most recent data).
- Develop a tracking signal, based on periods 5 through 8.
- Does your tracking signal indicate the model is tracking the data:
A. okay
B. poorly
C. Indicates nothing about the models tracking.,
- Calculate a bias based on periods 19 to 22.
- Does your bias indicate the model tends to:
A. Over-estimate
B. Under-Estimate.
C. No bias found.
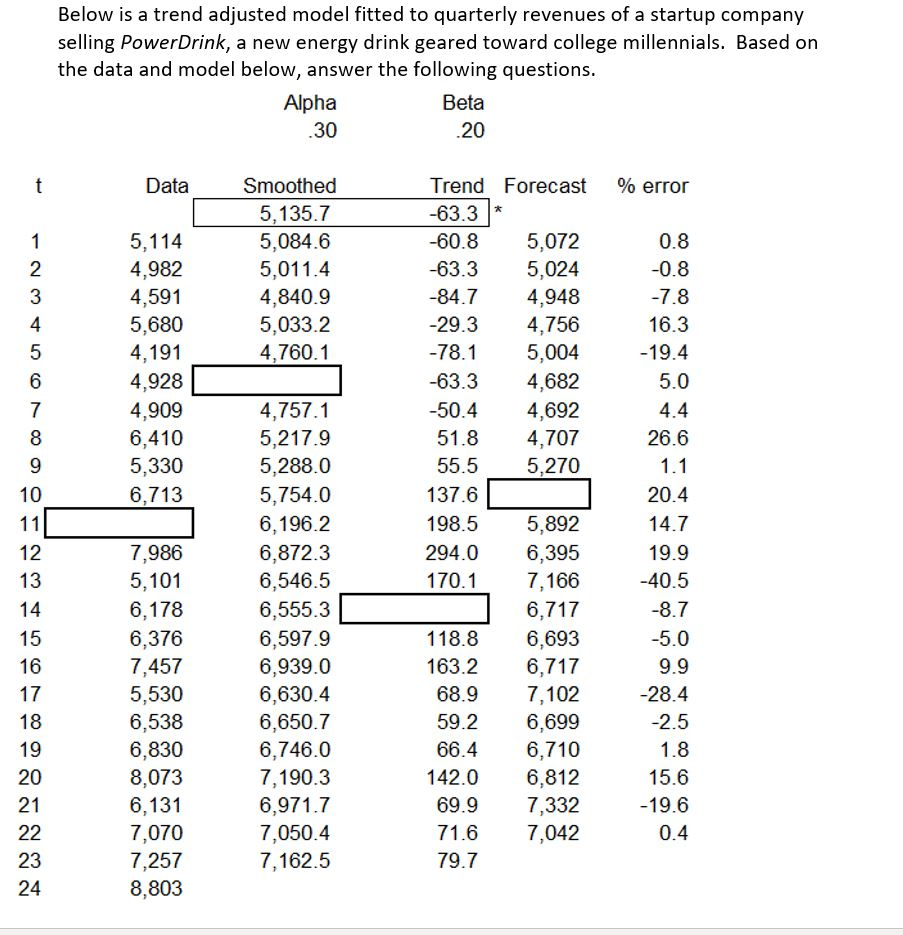
Below is a trend adjusted model fitted to quarterly revenues of a startup company selling PowerDrink, a new energy drink geared toward college millennials. Based on the data and model below, answer the following questions. Alpha Beta .30 .20 t Data Trend Forecast % error -63.3 * Smoothed 5,135.7 5,084.6 5,011.4 4,840.9 5,033.2 4,760.1 1 2 3 4 5 6 7 8 9 10 5,114 4,982 4,591 5,680 4,191 4,928 4,909 6,410 5,330 6,713 -60.8 -63.3 -84.7 -29.3 -78.1 -63.3 -50.4 51.8 55.5 137.6 198.5 294.0 170.1 5,072 5,024 4,948 4,756 5,004 4,682 4,692 4,707 5,270 11 12 13 14 15 16 17 18 19 20 21 22 23 24 0.8 -0.8 -7.8 16.3 -19.4 5.0 4.4 26.6 1.1 20.4 14.7 19.9 -40.5 -8.7 -5.0 9.9 -28.4 -2.5 1.8 15.6 -19.6 0.4 4,757.1 5,217.9 5,288.0 5,754.0 6,196.2 6,872.3 6,546.5 6,555.3 6,597.9 6,939.0 6,630.4 6,650.7 6,746.0 7,190.3 6,971.7 7,050.4 7,162.5 7,986 5,101 6,178 6,376 7,457 5,530 6,538 6,830 8,073 6,131 7,070 7,257 8,803 5,892 6,395 7,166 6,717 6,693 6,717 7,102 6,699 6,710 6,812 7,332 7,042 118.8 163.2 68.9 59.2 66.4 142.0 69.9 71.6 79.7Step by Step Solution
There are 3 Steps involved in it
1 Expert Approved Answer
Step: 1 Unlock

Question Has Been Solved by an Expert!
Get step-by-step solutions from verified subject matter experts
Step: 2 Unlock
Step: 3 Unlock