

Question: Using the Westwood Man-hours data.jmp file perform a simple linear regression: Describe what you find out about the field relationships using Distributions under JMP's Analyze
- Using the "Westwood Man-hours data.jmp" file perform a simple linear regression:
- Describe what you find out about the field relationships using Distributions under JMP's Analyze tab to just look at the data. Is there a relationship possibly? How strong? 5
- Illustrate a simple linear regression using JMP's "Fit-Y-by-X" capability under the Analyze tab. From "Bivariate Fit", select "Fit Line". 5
- Describe the results:
- Linear Fit - Describe the equation in words. Is there a meaningful intercept?
- Summary of Fit - Explain the significance of Rsquare.
- Lack of Fit - Using Prob>F and alpha draw conclusions on the null hypothesis "No lack of Fit"
- Analysis of Variance - Using Prob>F and alpha draw conclusions on the null hypothesis "Model is not significant"
- Parameter Estimates - Explain the findings on the Intercept and slope estimates. 5
- Residual Analysis from "Linear Fit":
- "Save residuals" and return to data table.
- Using Analyze>Distributions, plot the histogram of residuals.
- Using Residuals>Continuous Fit>Normal, display normal fit on the residuals.
- Using Fitted Normal>Goodness of Fit, determine if the residuals are normal using the Shapiro-Wilk W Test. 5
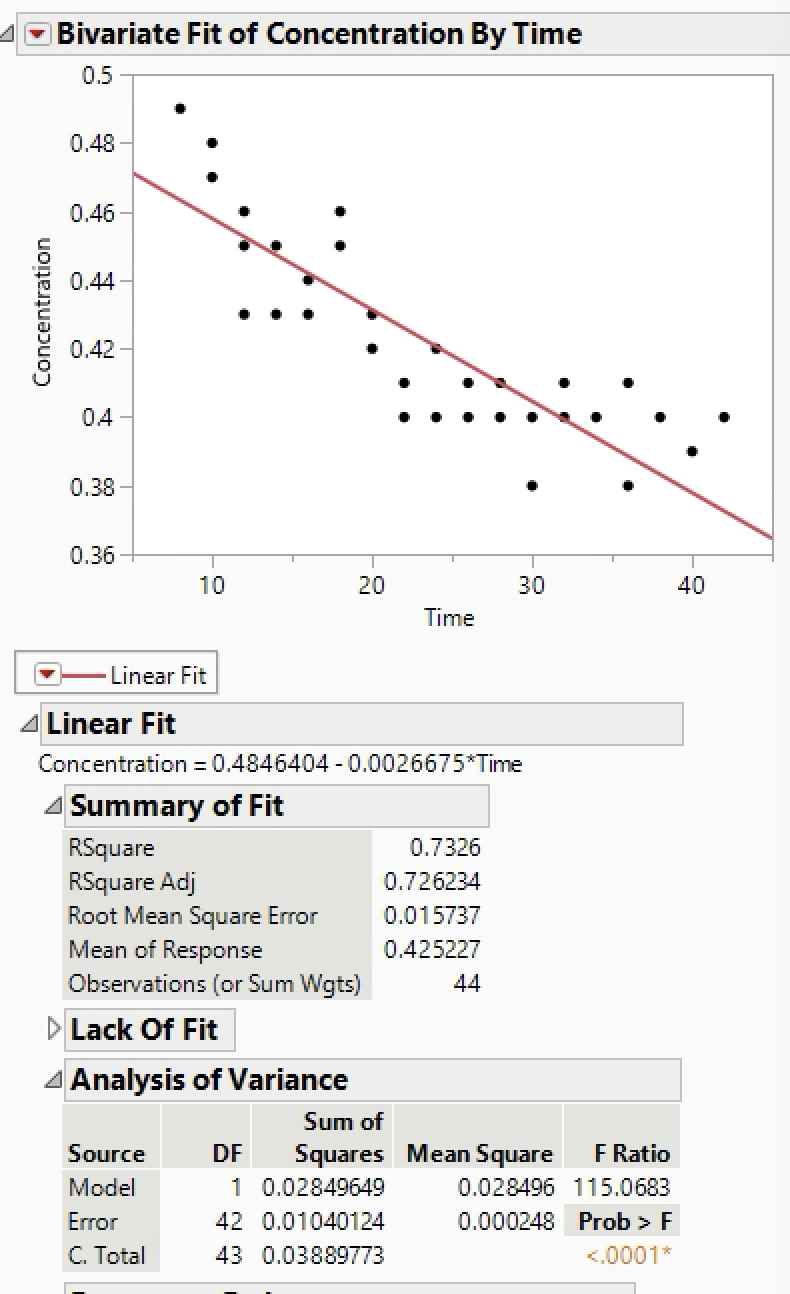
Bivariate Fit of Concentration By Time 0.5 0.48 0.46 0.44 Concentration 0.42 04 0.38 0.36 10 20 30 40 Time Linear Fit Linear Fit Concentration = 0.4846404 - 0.0026675*Time Summary of Fit RSquare 0.7326 RSquare Adj 0.726234 Root Mean Square Error 0.015737 Mean of Response 0.425227 Observations (or Sum Wgts) 44 D Lack Of Fit Analysis of Variance Sum of Source DF Squares Mean Square F Ratio Model 1 0.02849649 0.028496 115.0683 Error 42 0.01040124 0.000248 Prob > F C. Total 43 0.03889773 <.0001>
Step by Step Solution
There are 3 Steps involved in it
1 Expert Approved Answer
Step: 1 Unlock

Question Has Been Solved by an Expert!
Get step-by-step solutions from verified subject matter experts
Step: 2 Unlock
Step: 3 Unlock