

Question: Using theraw dataselect the sample that represents the breaking distance of specific cars. Let?X represent the number of cars whose breaking distance was less than
Using theraw dataselect the sample that represents the breaking distance of specific cars. Let?X represent the number of cars whose breaking distance was less than 130 feet. Use this information to find the confidence interval for the percentage of cars whose breaking distance is less than 130 feet.
- n=
- x=
State your assumption:
- In words define the random variable (sample proportion)
- State the estimated distribution to use
- use appropriate graph to illustrate the data
Find the confidence interval:
- how much area in both tails combined? Standard deviation=
- how much area in each tail? Standard deviation/2
- what is z standaard divation2
- construct interval:
- error:
- confidence interval:
- Fill in the blanks on the graph with the area in each section. Then fill in the number line with the upper and lower limits of the confidence interval and the sample proportion.
- 50%
- 80%
- 95%
- 99%
Interpret the data what can you conclude:
- what happens to the error as the confidence level increases? Does the width of the confidence interval decrease? explain why this happens.
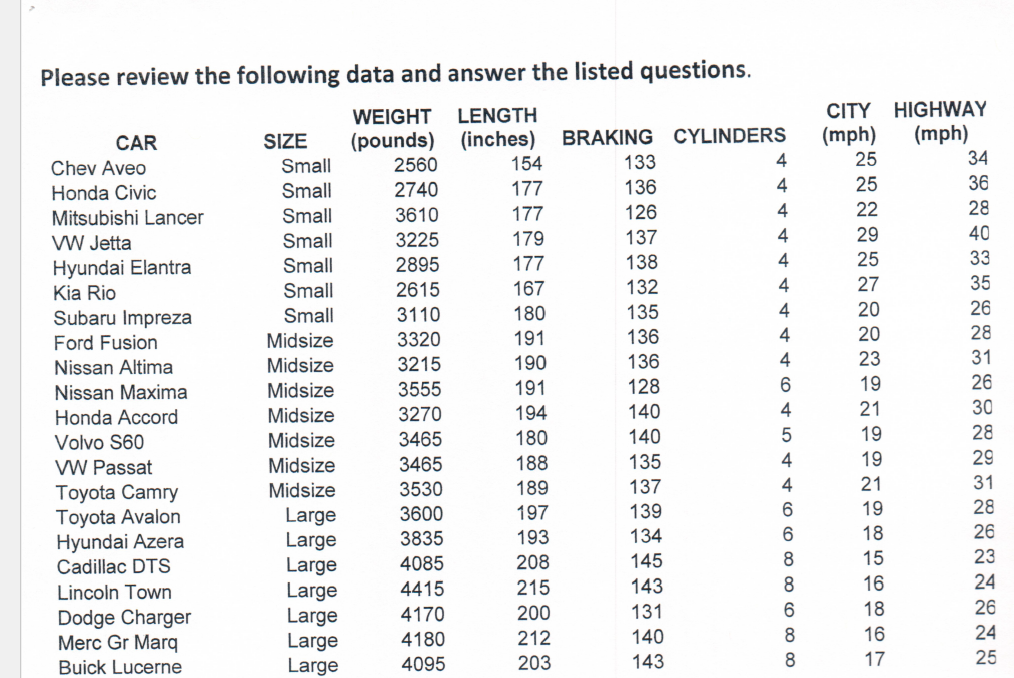
Please review the following data and answer the listed questions. WEIGHT LENGTH CAR SIZE CITY HIGHWAY Chev Aveo (pounds) (inches) BRAKING CYLINDERS Small (mph) 2560 (mph) 154 133 Honda Civic 4 Small 25 34 2740 177 136 Mitsubishi Lancer 25 Small 36 3610 177 VW Jetta 126 22 Small 28 3225 179 137 Hyundai Elantra 29 40 Small 2895 177 Kia Rio 138 25 33 Small 2615 167 132 Subaru Impreza 27 35 Small 3110 180 Ford Fusion 135 20 Midsize 26 3320 191 136 Nissan Altima 20 28 Midsize 3215 190 136 Nissan Maxima 23 31 Midsize 3555 191 Honda Accord 128 19 26 Midsize 3270 194 140 Volvo S60 21 Midsize 30 3465 180 140 VW Passat 19 28 Midsize 3465 188 Toyota Camry 135 19 Midsize 29 3530 189 Toyota Avalon 137 21 31 Large 3600 197 Hyundai Azera 139 OO OOO OOOOOOARUIAOAAAAAAAA 19 28 Large 3835 193 Cadillac DTS 134 18 26 Large 4085 208 145 Lincoln Town 15 23 Large 4415 215 143 Dodge Charger 16 24 Large 4170 200 131 Merc Gr Marq 18 26 Large 4180 212 140 Buick Lucerne 16 24 Large 4095 203 143 17 25
Step by Step Solution
There are 3 Steps involved in it

Get step-by-step solutions from verified subject matter experts