

Question: Look at the histogram below, which shows mileage, in miles per gallon (mpg), for a random selection of older passenger cars.t Histogram of mpg
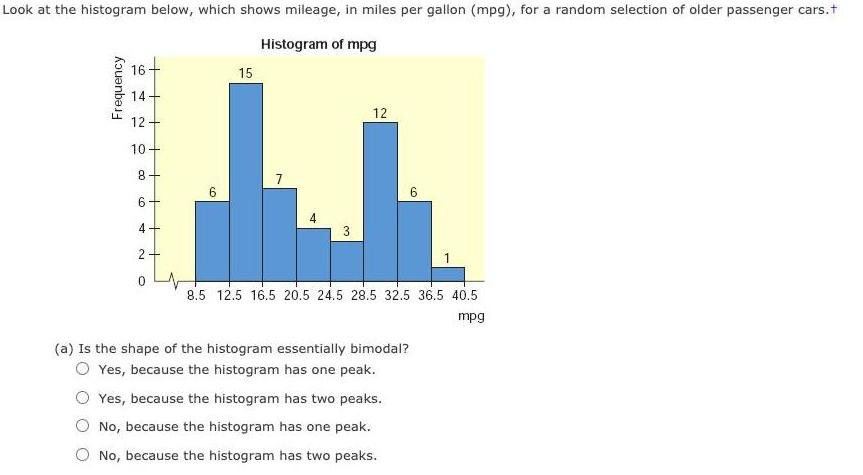
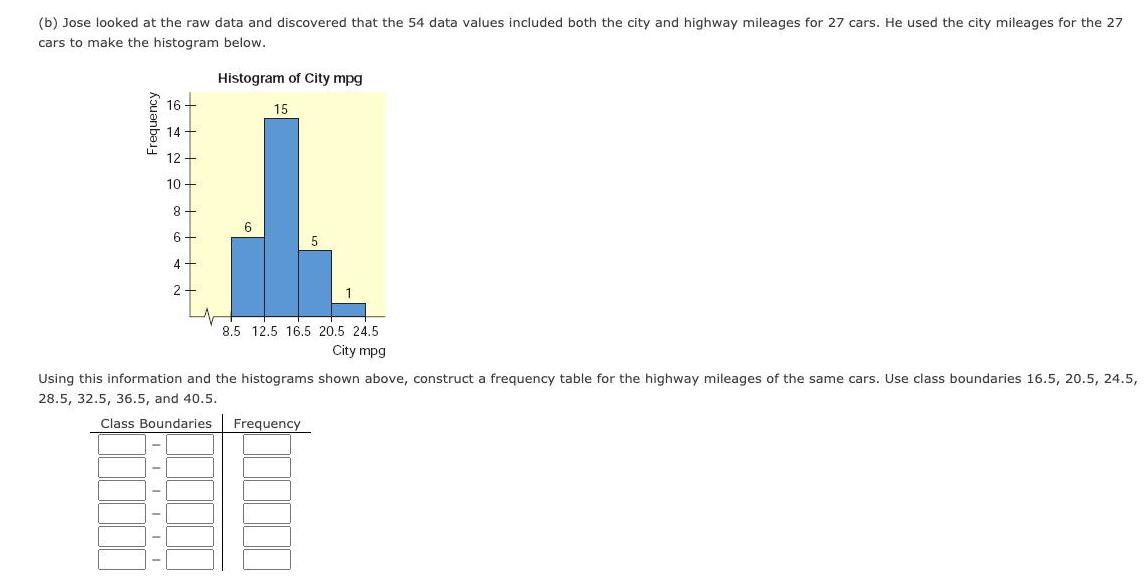
Look at the histogram below, which shows mileage, in miles per gallon (mpg), for a random selection of older passenger cars.t Histogram of mpg 16+ 15 14+ 12 12+ 10+ 8+ 6. 6+ 4+ 2+ 8.5 12.5 16.5 20.5 24.5 28.5 32.5 36.5 40.5 mpg (a) Is the shape of the histogram essentially bimodal? Yes, because the histogram has one peak. Yes, because the histogram has two peaks. No, because the histogram has one peak. No, because the histogram has two peaks. Frequency (b) Jose looked at the raw data and discovered that the 54 data values included both the city and highway mileages for 27 cars. He used the city mileages for the 27 cars to make the histogram below. Histogram of City mpg 16 + 15 14 - 12 - 10 - 6. 6+ 4 2. 8,5 12.5 16,5 20.5 24.5 City mpg Using this information and the histograms shown above, construct a frequency table for the highway mileages of the same cars. Use class boundaries 16.5, 20.5, 24.5, 28.5, 32.5, 36.5, and 40.5. Class Boundaries Frequency Frequency
Step by Step Solution
3.47 Rating (150 Votes )
There are 3 Steps involved in it
a Is the shape of the histogram essentially bimodal ... View full answer

Get step-by-step solutions from verified subject matter experts