

Question: V. [30 points] Choose a statistical test 1) Choose one appropriate statistical test, which is based on the level of measurement of DV and IV,
![V. [30 points] Choose a statistical test 1) Choose one appropriate](https://dsd5zvtm8ll6.cloudfront.net/si.experts.images/questions/2024/09/66eee11b41fb3_22766eee11b06dff.jpg)
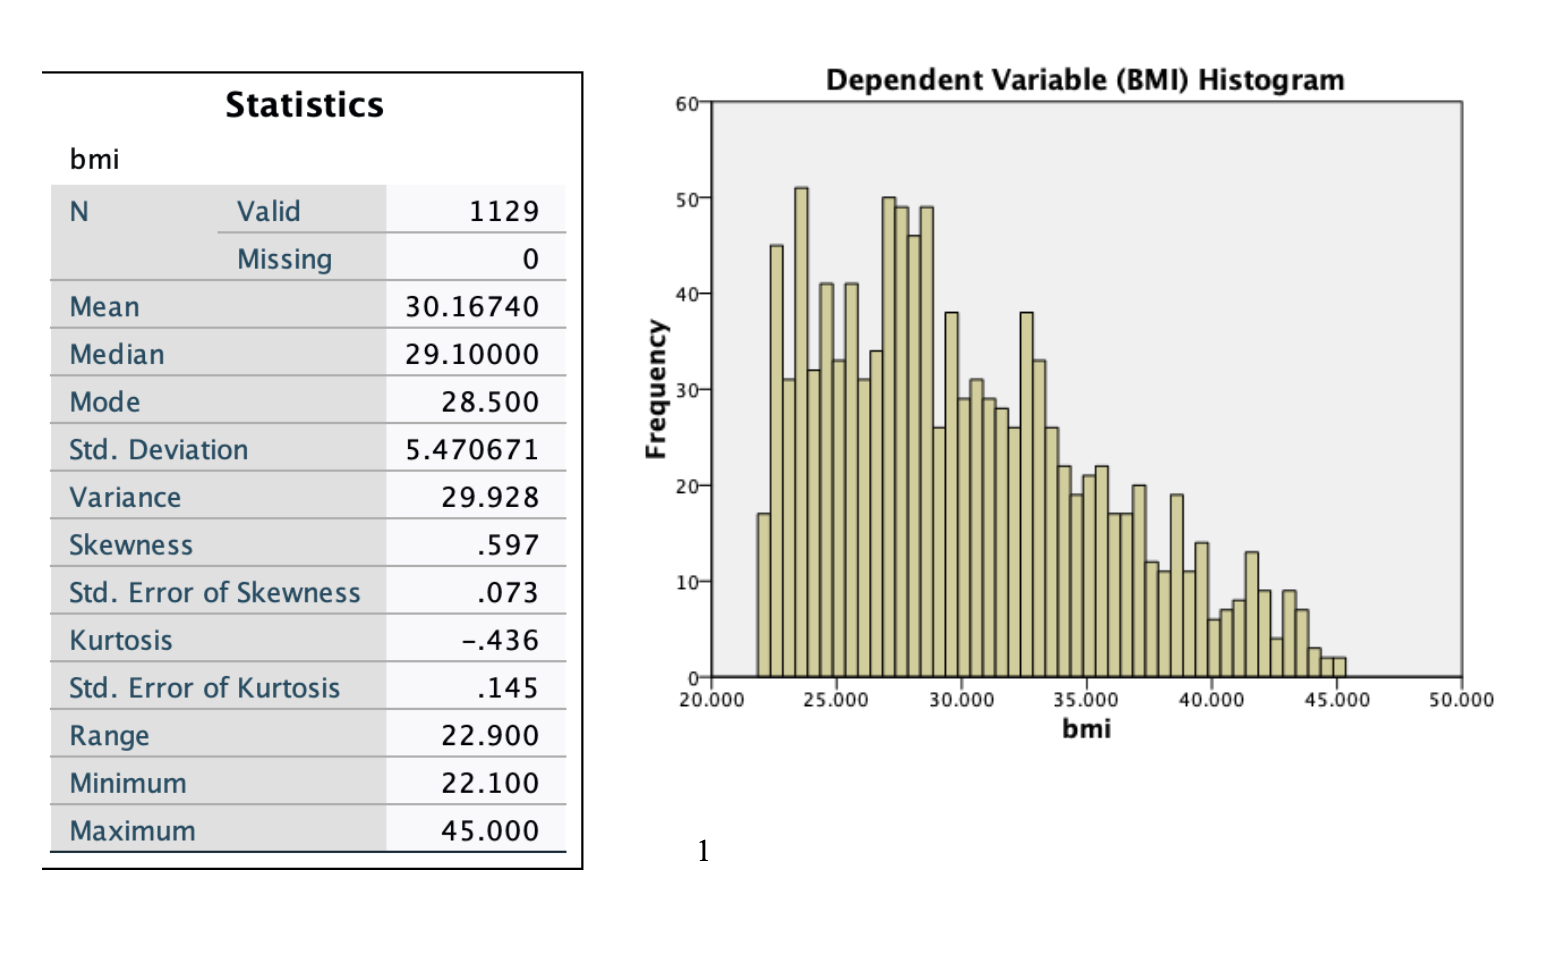
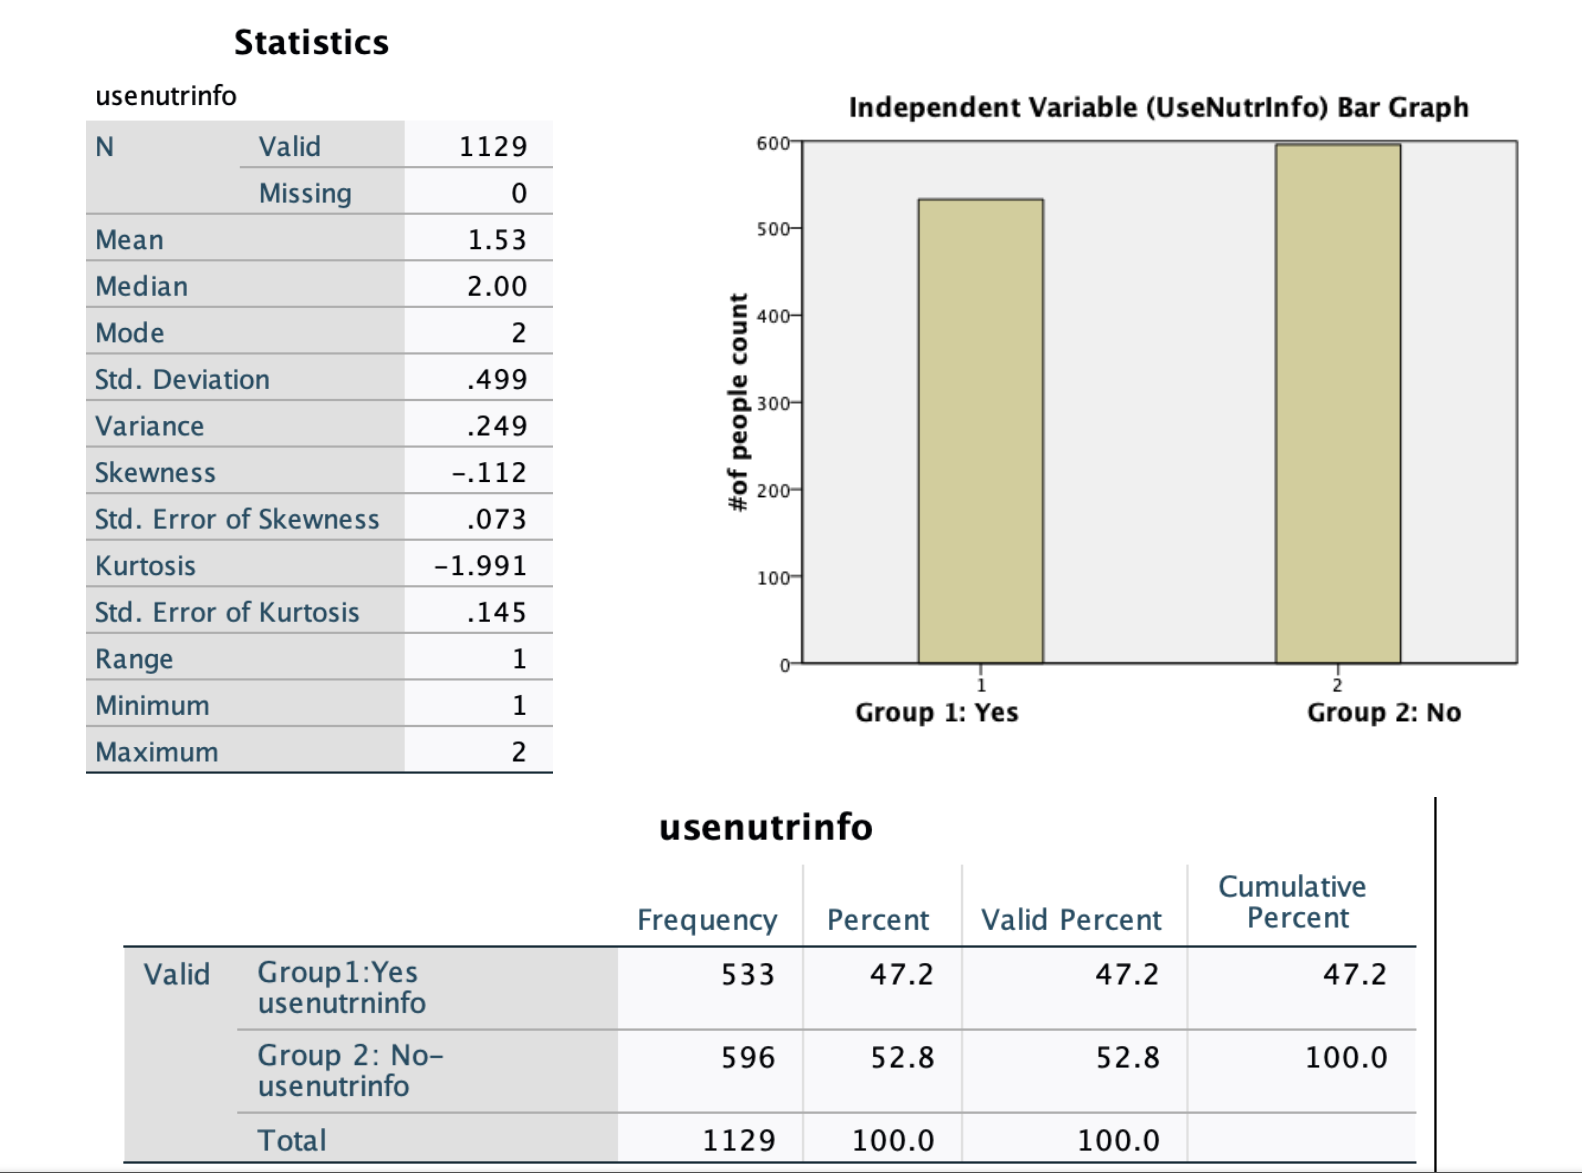
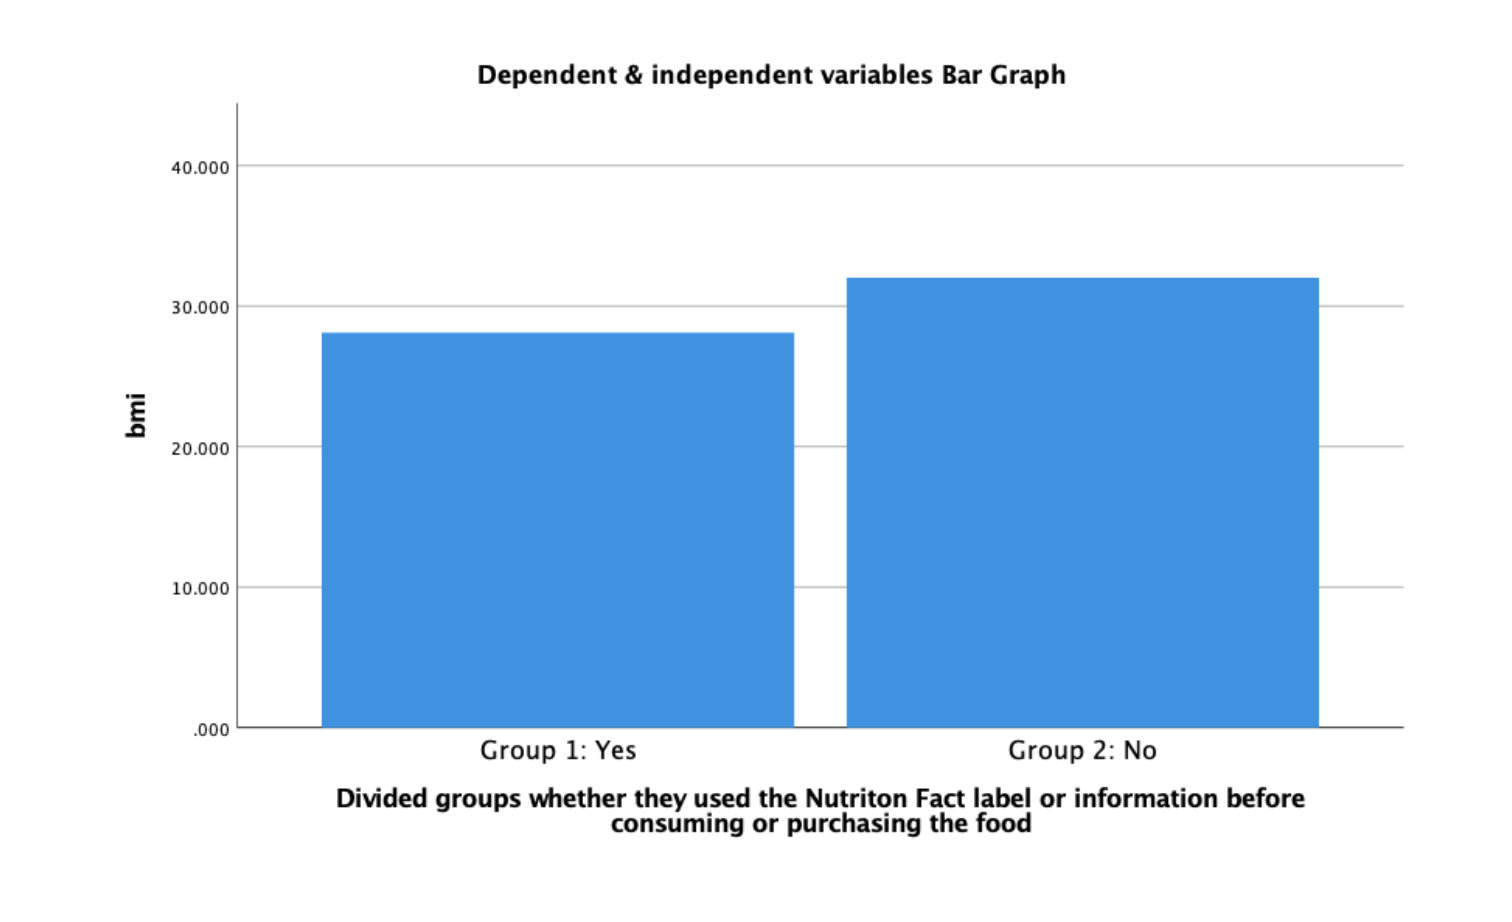
V. [30 points] Choose a statistical test 1) Choose one appropriate statistical test, which is based on the level of measurement of DV and IV, 2) Briefly explain the logical reason of choosing the test, 3) state the null (Ho) and alternative (HA) hypotheses of the test, 4) Show all the relevant SPSS output tables. Descriptive Statistics T-Test Std. N Minimum Maximum Mean Deviation One-Sample Statistics bmi 1129 22.100 45.000 30.16740 5.470671 Std. Std. Error N Mean Deviation Mean usenutrinfo 1129 1.53 499 bmi 1129 30.16740 5.470671 162815 Valid N (listwise) 1 129 usenutrinfo 1129 1.53 .499 015 One-Sample Test Test Value = 0 95% Confidence Interval of sig. (2- Mean the Difference df tailed) Difference Lower Upper bmi 185.287 1128 000 30.167405 29.84795 30.48686 usenutrinfo 102.791 1128 000 1.528 1.50 1.56 One-Sample Effect Sizes Standardizera Point 95% Confidence Interval Estimate Lower Upper bmi Cohen's d 5.470671 5.514 5.279 5.749 Hedges' correction 5.474312 5.511 5.276 5.745 usenutrinfo Cohen's d .499 3.059 2.920 3.198 Hedges' correction .500 3.057 2.918 3.196 a. The denominator used in estimating the effect sizes. Cohen's d uses the sample standard deviation. Hedges' correction uses the sample standard deviation, plus a correction factor. VI. Your overall conclusions [30 points] At least answer the following questions based on your SPSS output table i.e. how many total valid observations are in the sample? what is the average mean of each group, number of people in each group, what is the test statistics value?, what is the p-value? etc. Explaining the statistical results. (at least 50 words)Dependent Variable (BMI) Histogram Statistics 60 bmi N Valid 1129 50- Missing 0 30.16740 40- Mean Median 29.10000 Frequency Mode 28.500 30- Std. Deviation 5.470671 Variance 29.928 20- Skewness .597 Std. Error of Skewness .073 10- Kurtosis -.436 Std. Error of Kurtosis 145 0- 20.000 25.000 30.000 35.000 40.000 45.000 50.000 Range 22.900 bmi Minimum 22.100 Maximum 45.000Statistics usenutrinfo Independent Variable (UseNutrinfo) Bar Graph N Valid 1129 600 Missing 0 Mean 1.53 500- Median 2.00 : 400- Mode 2 Std. Deviation 499 #of people count . 300- Variance 249 Skewness -.112 200- Std. Error of Skewness .073 Kurtosis -1.991 100- Std. Error of Kurtosis 145 Range 1 Minimum H Group 1: Yes Group 2: No Maximum 2 usenutrinfo Cumulative Frequency Percent Valid Percent Percent Valid Group 1:Yes 533 47.2 47.2 47.2 usenutrninfo Group 2: No- 596 52.8 52.8 100.0 usenutrinfo Total 1129 100.0 100.0bml 40.000 30.000 20.000 10.000 .000 Dependent 8: independent variables Bar Graph Group 1: Yes Group 2: No Divided groups whether they used the Nutriton Fact label or information before consuming or purchasing the food
Step by Step Solution
There are 3 Steps involved in it

Get step-by-step solutions from verified subject matter experts