

Question: V: Exam Review: Prob. & Stat. A X Home I myLU C O webassign.net/web/Student/Assignment-Responses/submit?dep HW: Exam Review. Prob. & Stat. P X 25 Need Help?
![P X 25 Need Help? 23. [-/0.24 Points] DETAILS LARMPMTI 17.2.012. 0/100](https://s3.amazonaws.com/si.experts.images/answers/2024/06/6679fbc044fde_3356679fbbfbe6e5.jpg)
V: Exam Review: Prob. & Stat. A X
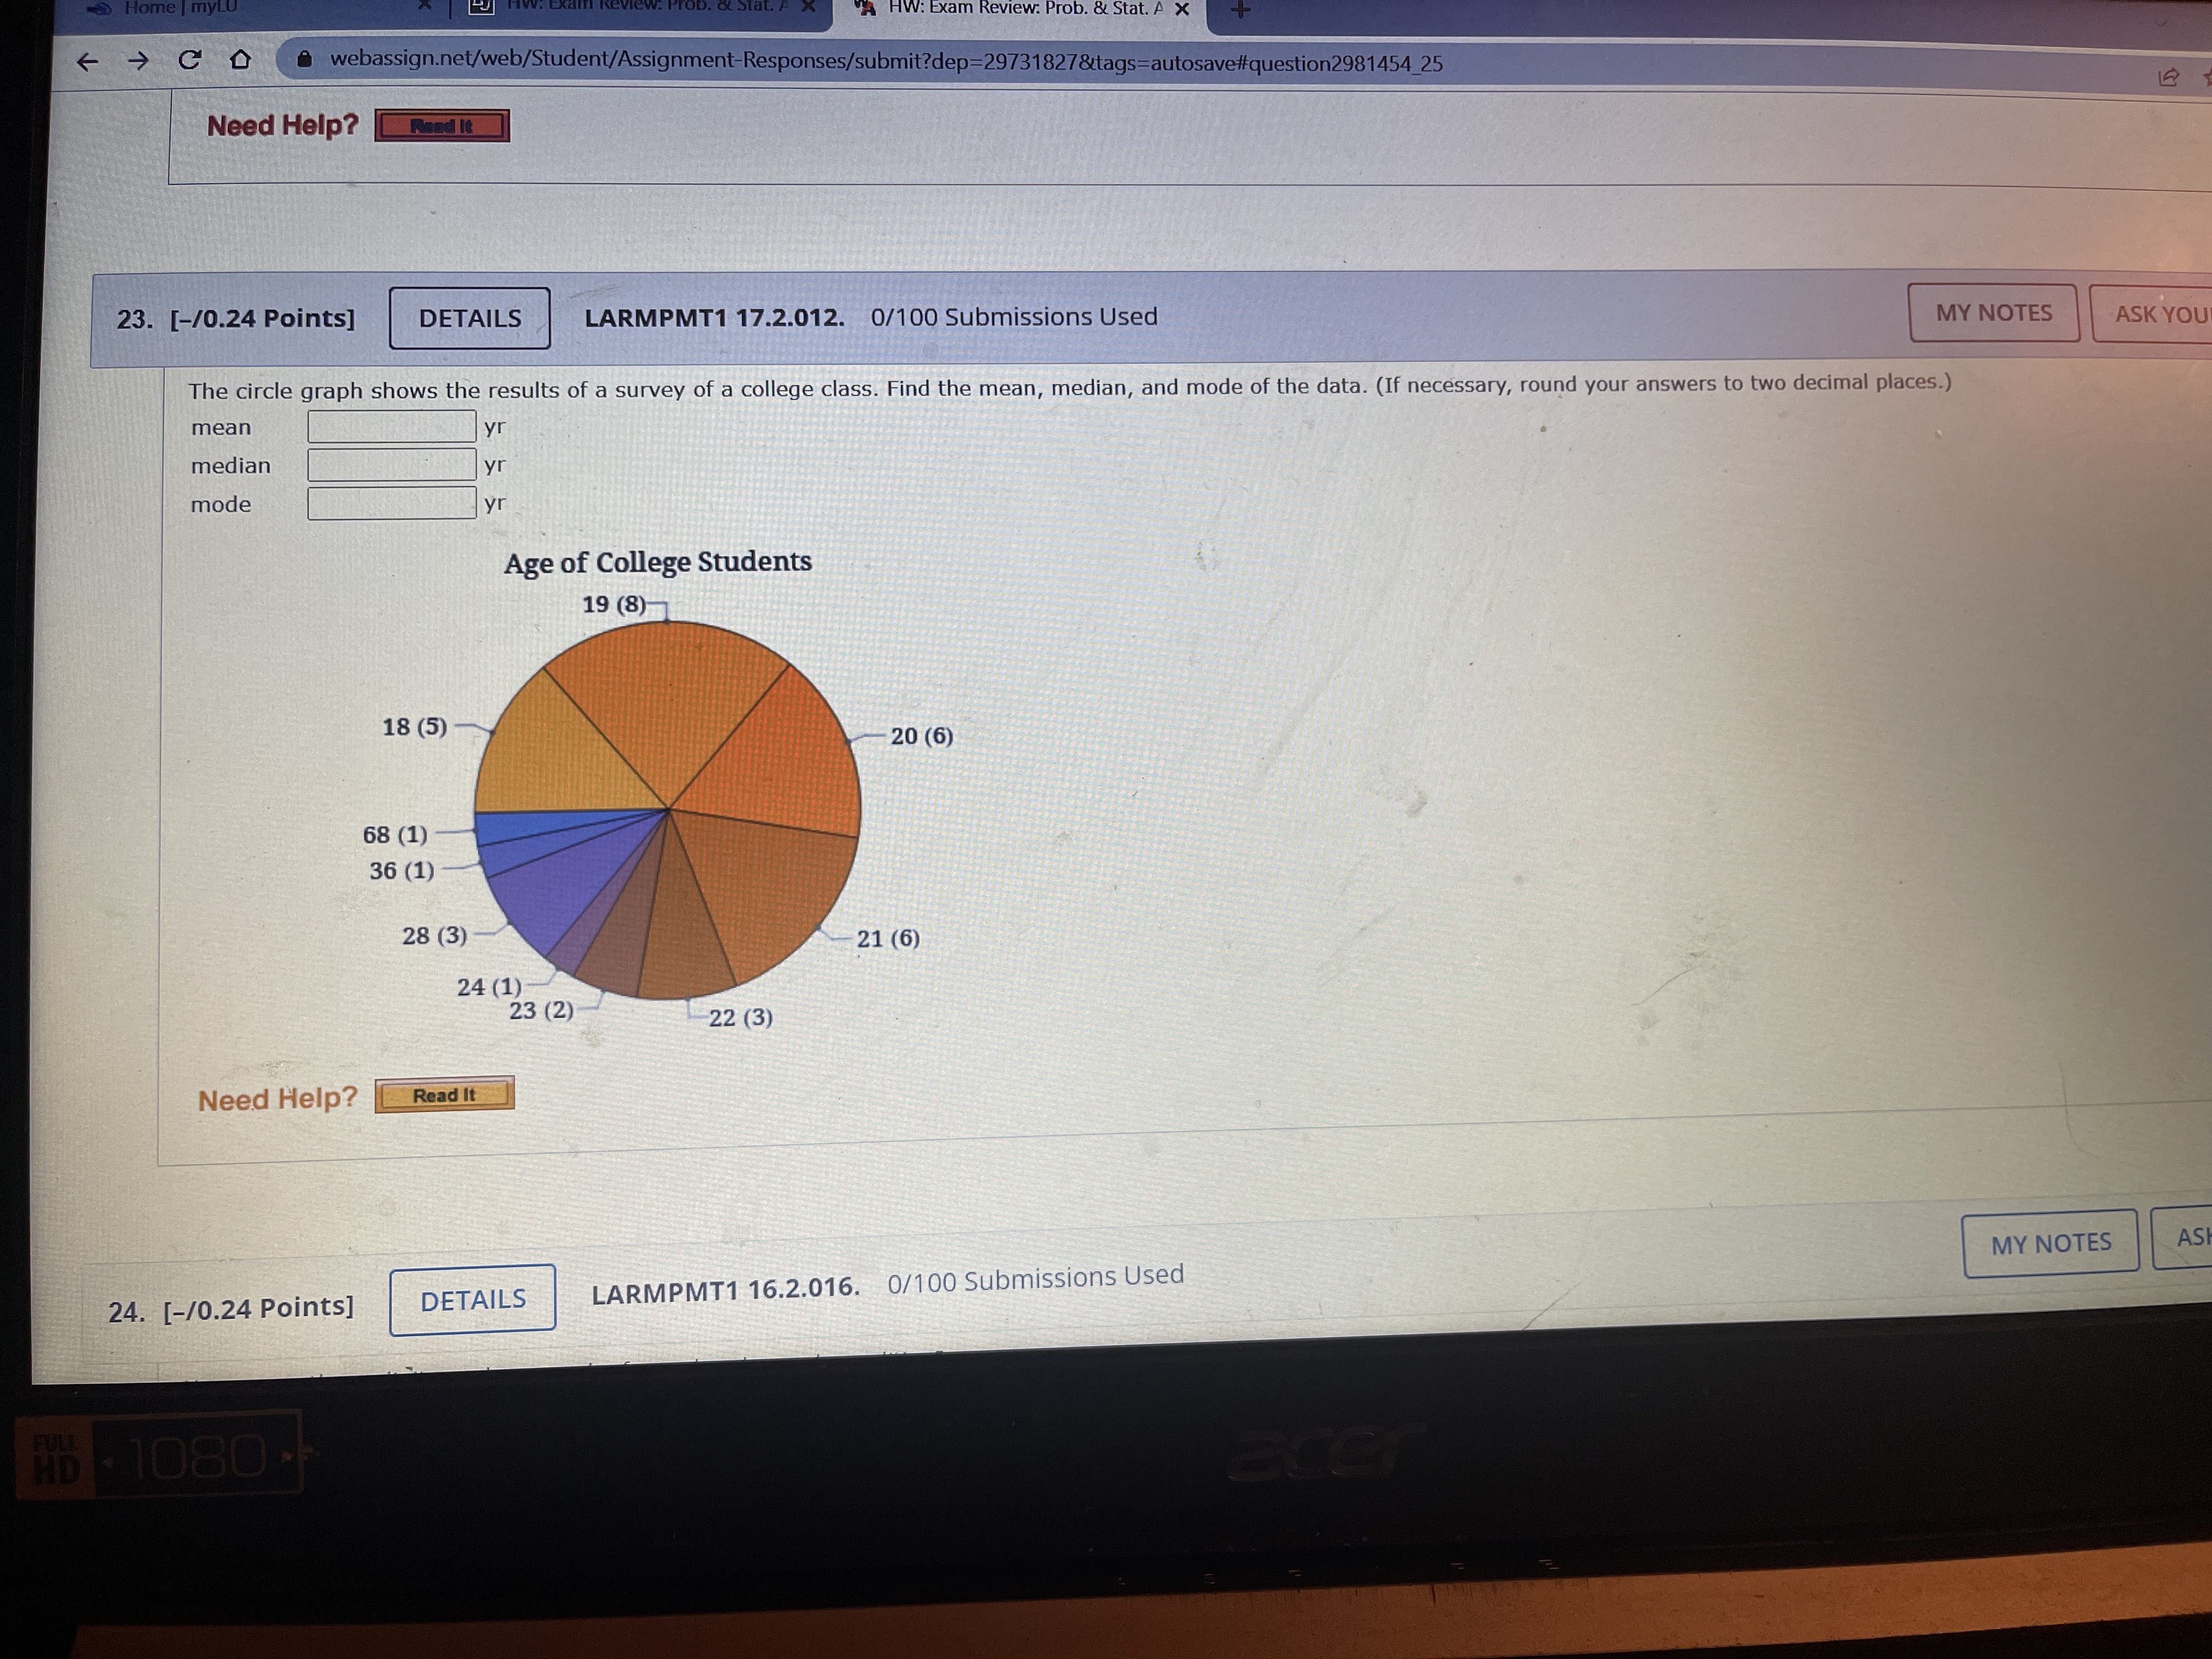
Home I myLU C O webassign.net/web/Student/Assignment-Responses/submit?dep HW: Exam Review. Prob. & Stat. P X 25 Need Help? 23. [-/0.24 Points] DETAILS LARMPMTI 17.2.012. 0/100 Submissions Used MY NOTES ASK YOU The circle graph shows the results of a survey of a college class. Find the mean, median, and mode of the data. (If necessary, round your answers to two decimal places.) mean median mode Yr Age of College Students 19 (8 18 (5) 68 (1) 36 (1) 28 (3) 24 (1) 23 (2) Need 20 (6) (6) L22 (3) LARMPMTI 16.2.016. MY NOTES 0/100 Submissions Used 24. [-/0.24 Points] DETAILS
Step by Step Solution
There are 3 Steps involved in it

Get step-by-step solutions from verified subject matter experts