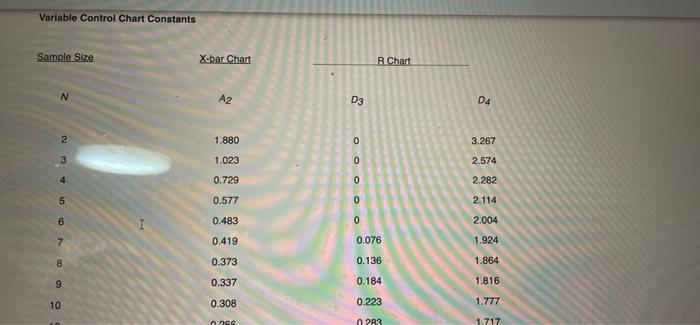
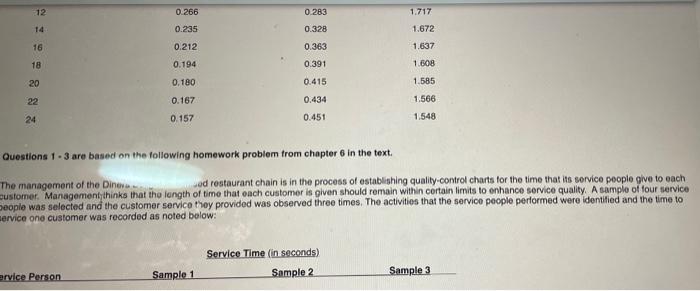
Question: Variable Control Chart Constants Sample Size N 2345 6 8 9 10 X-bar Chart A2 1.880 1.023 0.729 0.577 0.483 0.419 0.373 0.337 0.308 0766

Variable Control Chart Constants Sample Size N
Variable Control Chart Constants Sample Size N 2345 6 8 9 10 X-bar Chart A2 1.880 1.023 0.729 0.577 0.483 0.419 0.373 0.337 0.308 0766 D3 0 OOOOO 0 0 0 0 R Chart 0.076 0.136 0.184 0.223 0283 D4 3.267 2.574 2.282 2.114 2.004 1.924 1.864 1.816 1.777 1.717. 0.266 0.283 1,717 0.235 0.328 1.672 0.212 0.363 1.637 0.194 0.391 1.608 0,180 0.415 1.585 0.167 0.434 1.566 24 0.157 0.451 1.548 Questions 1-3 are based on the following homework problem from chapter 6 in the text. The management of the Diner od restaurant chain is in the process of establishing quality-control charts for the time that its service people give to each customer. Management thinks that the length of time that each customer is given should remain within certain limits to enhance service quality. A sample of four service people was selected and the customer service they provided was observed three times. The activities that the service people performed were identified and the time to service one customer was recorded as noted below: Service Time (in seconds) ervice Person Sample 1 Sample 3 Sample 2 12 14 16 18 20 22 The management of the Diners Delight franchised restaurant chain is in the process of establishing quality-control charts for the time that its service people give to each customer. Management thinks that the length of time that each customer is given should remain within certain limits to enhance service quality. A sample of four service people was selected and the customer service they provided was observed three times. The activities that the service people performed were identified and the time to service one customer was recorded as noted below: Service Time (in seconds) Service Pa Sample 1 Sample 2 Sample 3 1 120 90 150 130 110 200 180 165 155 2 3 140 175 140 What are the upper and lower control limits for an X-bar chart with a sample size of four? OA UCL = 146.25, LCL = 68.33 B.UCL = 182.05, LCL = 110.44 OC. UCL = 196.07, LCL = 96.43 OD. UCL = 199.36, LCL = 97.31 O E. none of the above What are the upper and lower control limits for an R-chart with a sample size of four? A. UCL 90.09, LCL = 0 B. UCL = 155.93, LCL = 0 OC.UCL = 192.69, LCL = 0 OD. UCL 199.36, LCL = 0 = O E. none of the above After the control chart was established, a new sample of customer service times in seconds was recorded: 185, 150, 192, and 178. Is the restaurant's customer service process in control? OA X-bar = 176.25, R=42; process is in control OB. X-bar = 176.25, R = 42; process is out of control C.X-bar = 180, R = 50; process is in control D. X-bar = 180, R = 50; process is out of control OE none of the above

Step by Step Solution

There are 3 Steps involved in it

1 Expert Approved Answer
Step: 1 Unlock blur-text-image
Question Has Been Solved by an Expert!

Get step-by-step solutions from verified subject matter experts

Step: 2 Unlock
Step: 3 Unlock

Students Have Also Explored These Related General Management Questions!