

Question: Variable N N* Mean SE Mean StDev Minimum Q1 Median Q3 Maximum Rental Fee 60 0 360.7 33.2 256.8 60.0 179.8 299.0 408.0 1135.0 Av
| Variable | N | N* | Mean | SE Mean | StDev | Minimum | Q1 | Median | Q3 | Maximum |
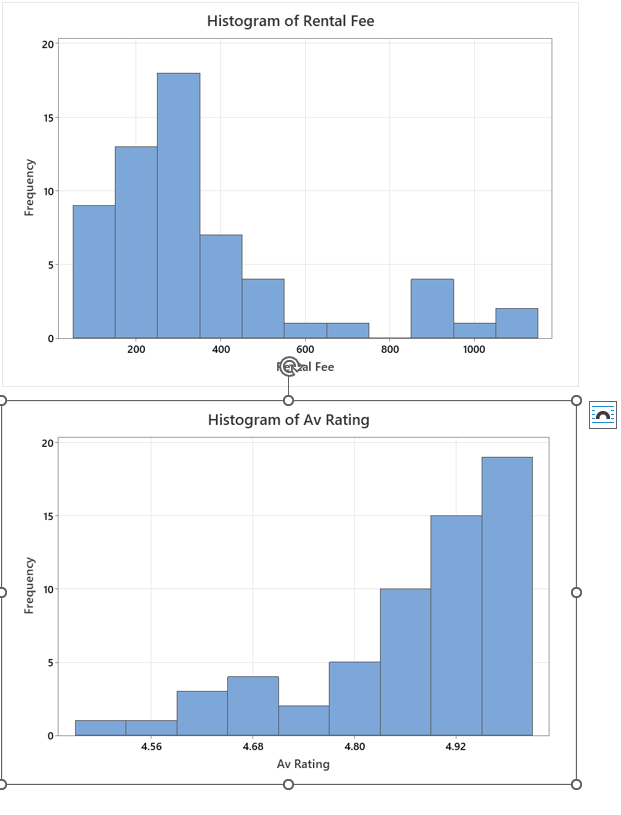
| Rental Fee | 60 | 0 | 360.7 | 33.2 | 256.8 | 60.0 | 179.8 | 299.0 | 408.0 | 1135.0 |
| Av Rating | 60 | 0 | 4.8698 | 0.0161 | 0.1247 | 4.5200 | 4.7850 | 4.9000 | 4.9675 | 5.0000 |
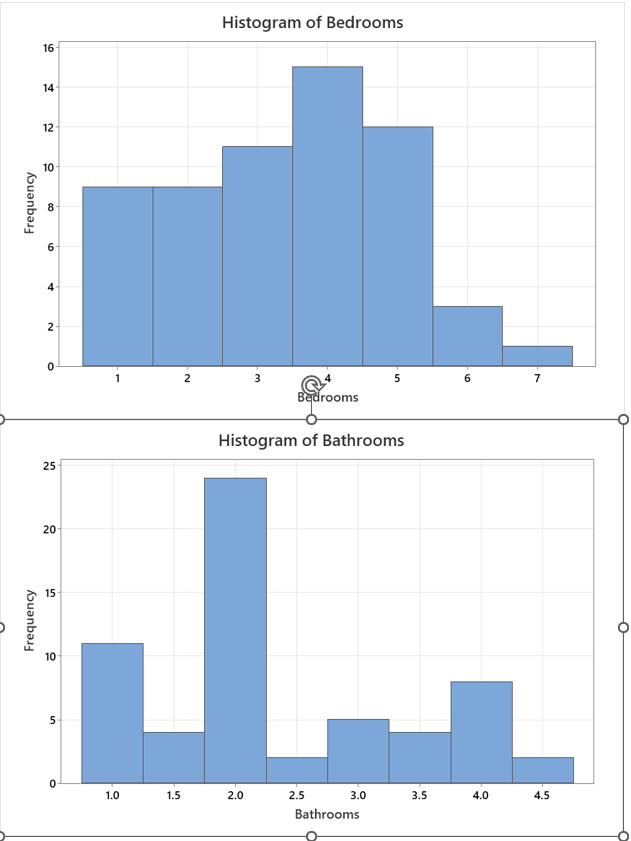
| Bedrooms | 60 | 0 | 3.417 | 0.199 | 1.544 | 1.000 | 2.000 | 4.000 | 5.000 | 7.000 |
| Bathrooms | 60 | 0 | 2.333 | 0.135 | 1.044 | 1.000 | 1.625 | 2.000 | 3.000 | 4.500 |
QUESTION 3: Data Visualization Tools
Review all Descriptive Statistics that were generated for all 4 variables. Then focus your attention on the 4 histograms that were created for the variables. Answer the following questions:
How do the graphs make the data easier to understand?
Use the graphs to identify and explain any interesting or important aspects of the data. Also, use the graphs to identify any trends or possible outliers
Histogram of Rental Fee Histogram of Bedrooms Histogram of Bathrooms Histogram of Rental Fee Histogram of Bedrooms Histogram of BathroomsStep by Step Solution
There are 3 Steps involved in it

Get step-by-step solutions from verified subject matter experts