

Question: variable N N* student/Faculty Ratio 48 0 Alumni Giving Rate 48 0 variable Q3 Student/Faculty Ratio 14.500 Alumni Giving Rate 39.50 Mean SE Mean StDev
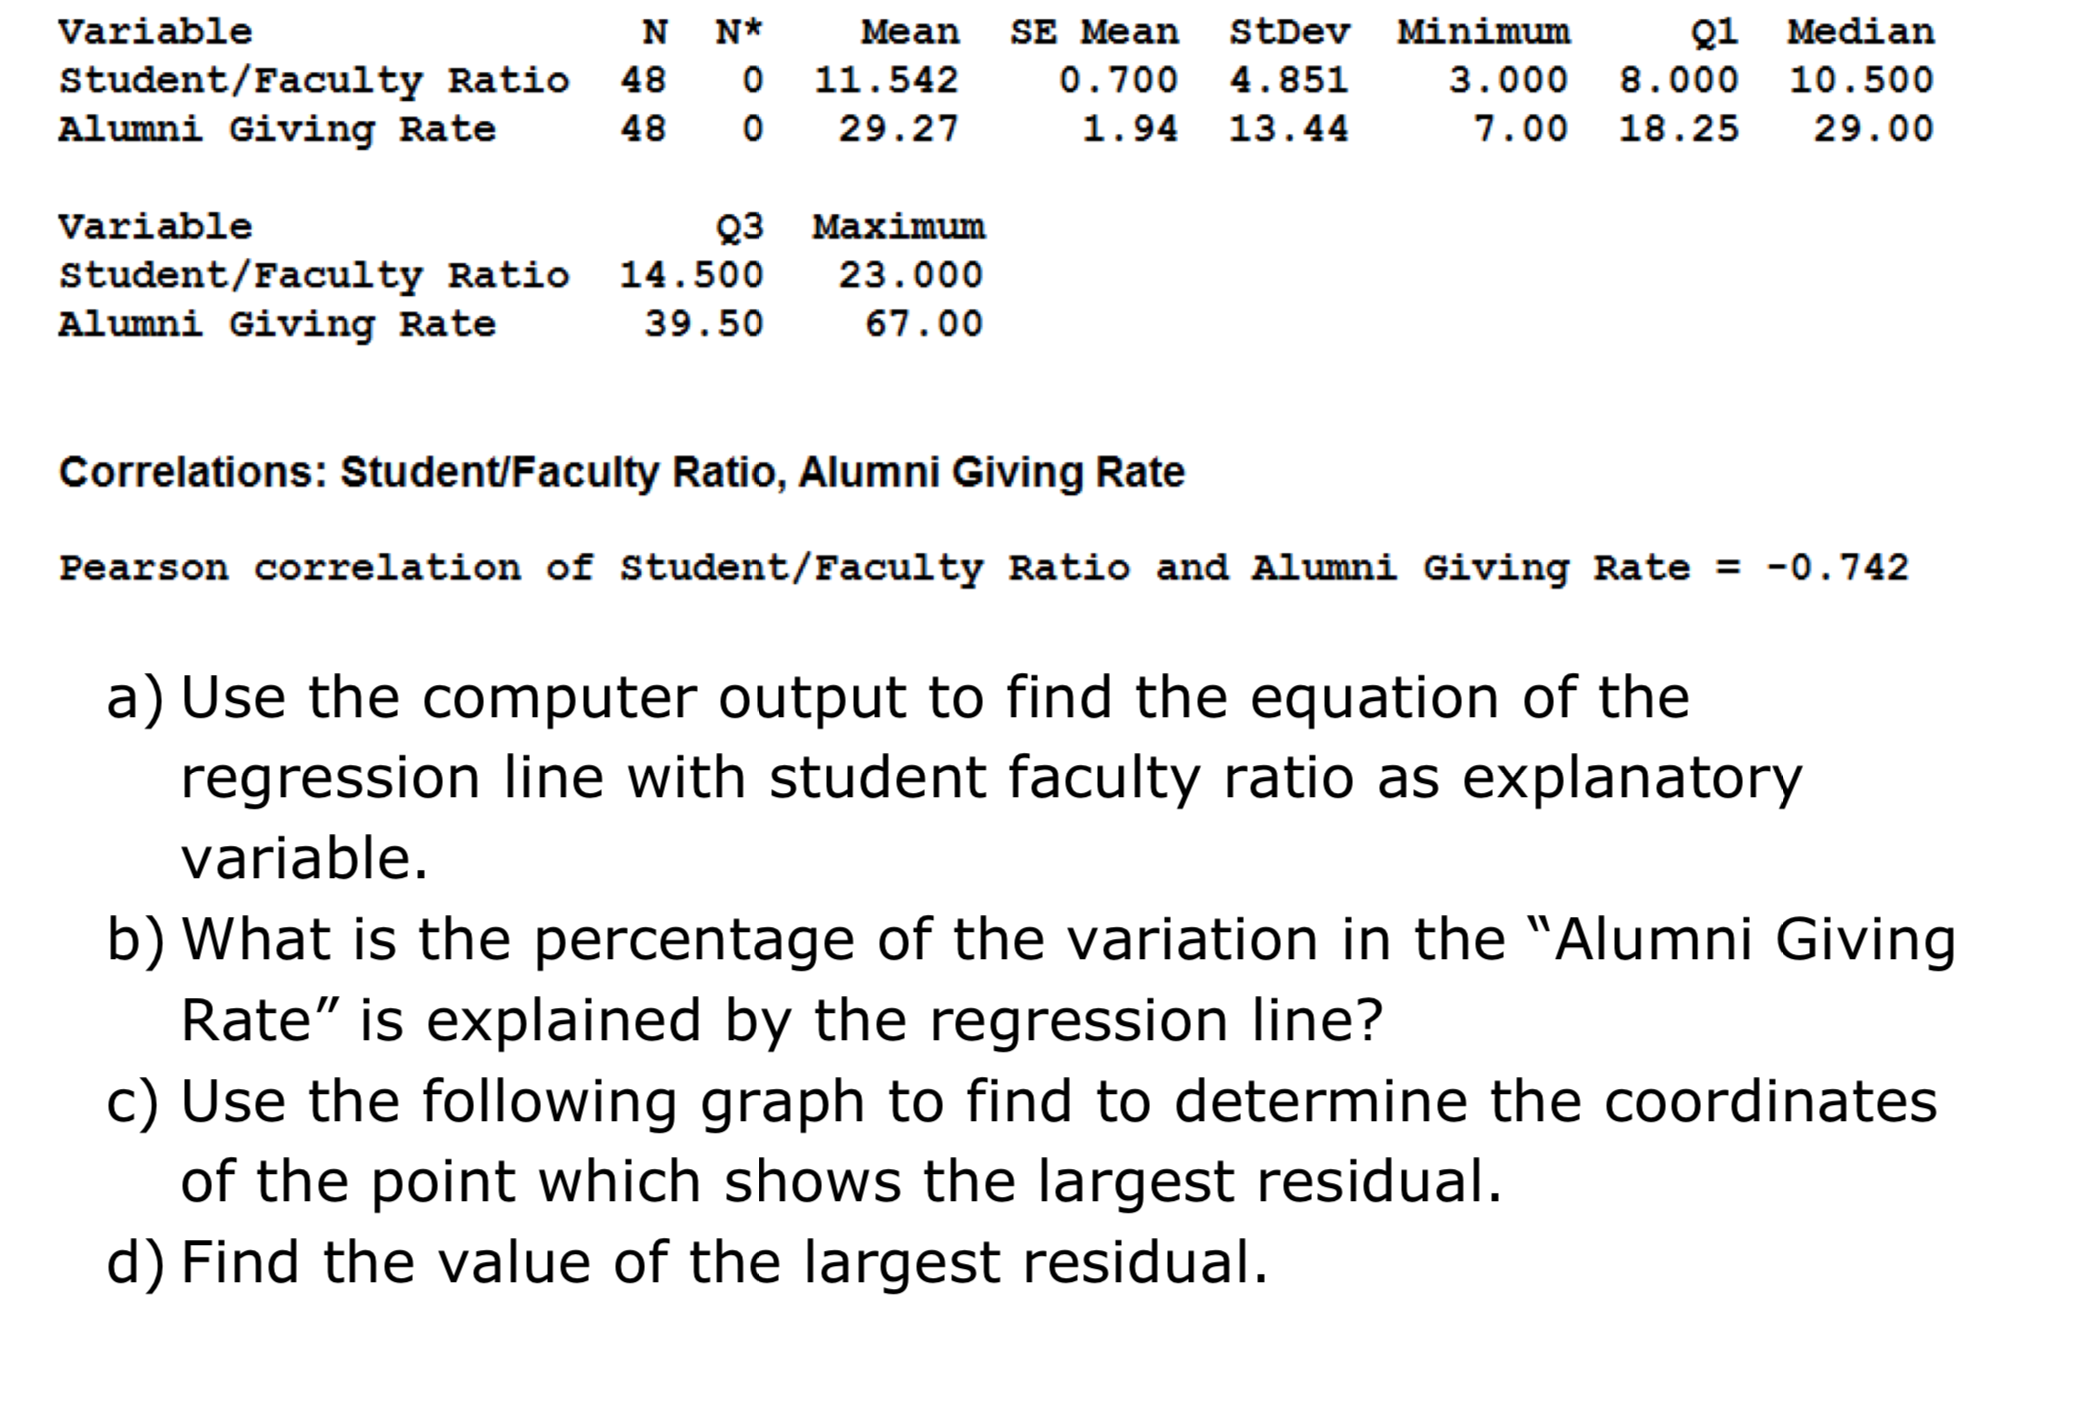
variable N N* student/Faculty Ratio 48 0 Alumni Giving Rate 48 0 variable Q3 Student/Faculty Ratio 14.500 Alumni Giving Rate 39.50 Mean SE Mean StDev Minimum 91 Median 11.542 0.700 4.851 3.000 8.000 10.500 29.27 1.94 13.44 7.00 18.25 29.00 Maximum 23.000 67.00 Correlations: Student/Faculty Ratio, Alumni Giving Rate Pearson correlation of student/Faculty Ratio and Alumni Giving Rate = -0.742 a) Use the computer output to find the equation of the regression line with student faculty ratio as explanatory variable. b) What is the percentage of the variation in the \"Alumni Giving Rate\" is explained by the regression line? c) Use the following graph to find to determine the coordinates of the point which shows the largest residual. cl) Find the value of the largest residual
Step by Step Solution
There are 3 Steps involved in it

Get step-by-step solutions from verified subject matter experts