

Question: Variance and standard deviation (expected). Hull Consultants, a famous think tank in the Midwest, has provided probability estimates for the four potential economic states for
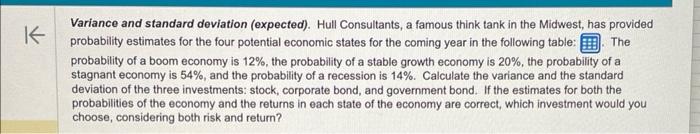
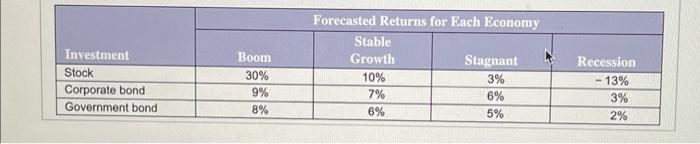
Variance and standard deviation (expected). Hull Consultants, a famous think tank in the Midwest, has provided probability estimates for the four potential economic states for the coming year in the following table: probability of a boom economy is 12%, the probability of a stable growth economy is 20%, the probability of a stagnant economy is 54%, and the probability of a recession is 14%. Calculate the variance and the standard deviation of the three investments: stock, corporate bond, and government bond. If the estimates for both the probabilities of the economy and the returns in each state of the economy are correct, which investment would you choose, considering both risk and return? \begin{tabular}{|l|c|c|c|c|} \hline \multirow{2}{*}{ Investment } & \multicolumn{4}{|c|}{ Forecasted Returns for Bach Bconomy } \\ \cline { 2 - 5 } & Boom & StableGrowth & Stagnant & Recession \\ \hline Stock & 30% & 10% & 3% & 13% \\ \hline Corporate bond & 9% & 7% & 6% & 3% \\ \hline Government bond & 8% & 6% & 5% & 2% \\ \hline \end{tabular} Variance and standard deviation (expected). Hull Consultants, a famous think tank in the Midwest, has provided probability estimates for the four potential economic states for the coming year in the following table: probability of a boom economy is 12%, the probability of a stable growth economy is 20%, the probability of a stagnant economy is 54%, and the probability of a recession is 14%. Calculate the variance and the standard deviation of the three investments: stock, corporate bond, and government bond. If the estimates for both the probabilities of the economy and the returns in each state of the economy are correct, which investment would you choose, considering both risk and return? \begin{tabular}{|l|c|c|c|c|} \hline \multirow{2}{*}{ Investment } & \multicolumn{4}{|c|}{ Forecasted Returns for Bach Bconomy } \\ \cline { 2 - 5 } & Boom & StableGrowth & Stagnant & Recession \\ \hline Stock & 30% & 10% & 3% & 13% \\ \hline Corporate bond & 9% & 7% & 6% & 3% \\ \hline Government bond & 8% & 6% & 5% & 2% \\ \hline \end{tabular}
Step by Step Solution
There are 3 Steps involved in it

Get step-by-step solutions from verified subject matter experts