

Question: Old MathJax webview Variance and standard deviation (expected). Hull Consultants, a famous think tank in the Midwest, has provided probability estimates for the four potential
Old MathJax webview
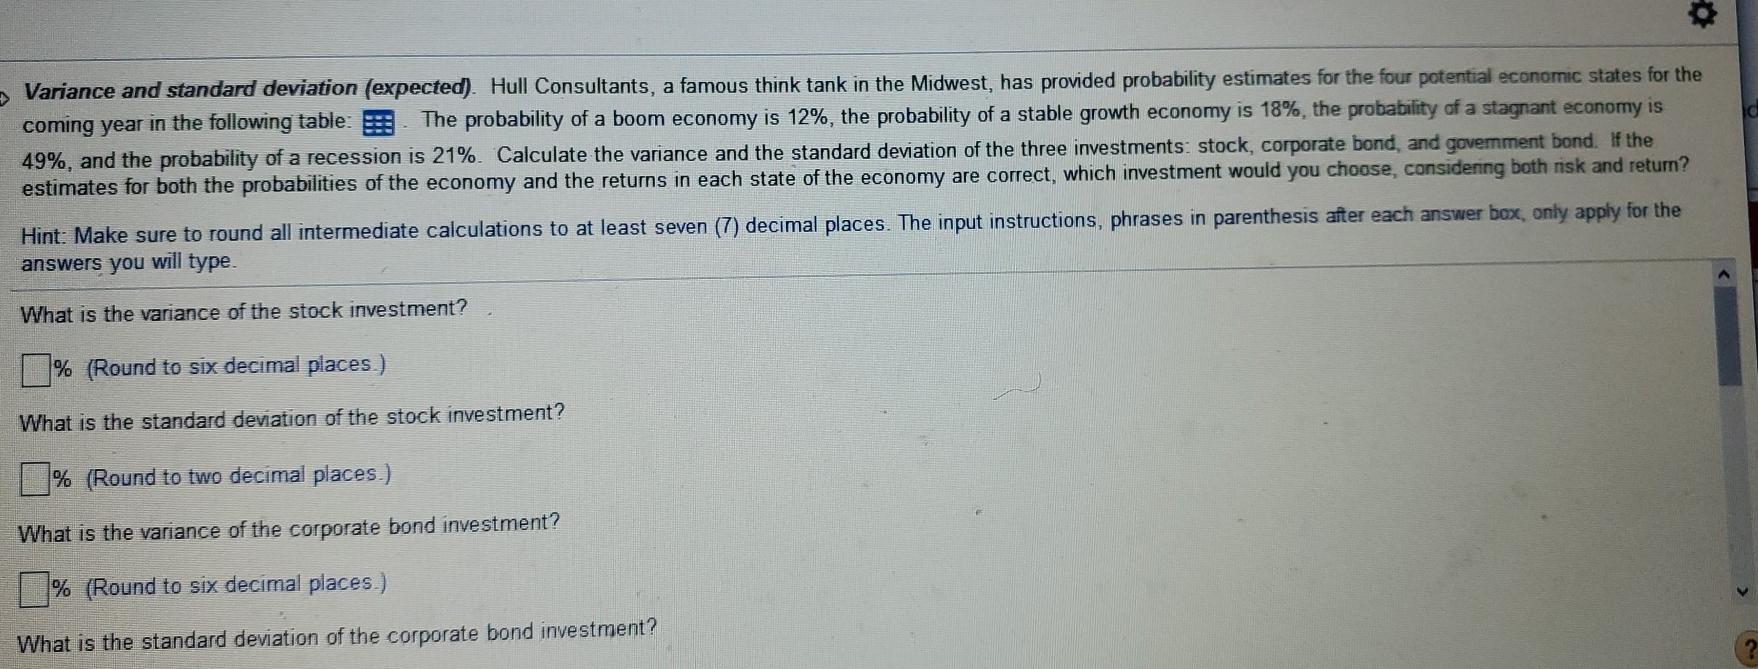
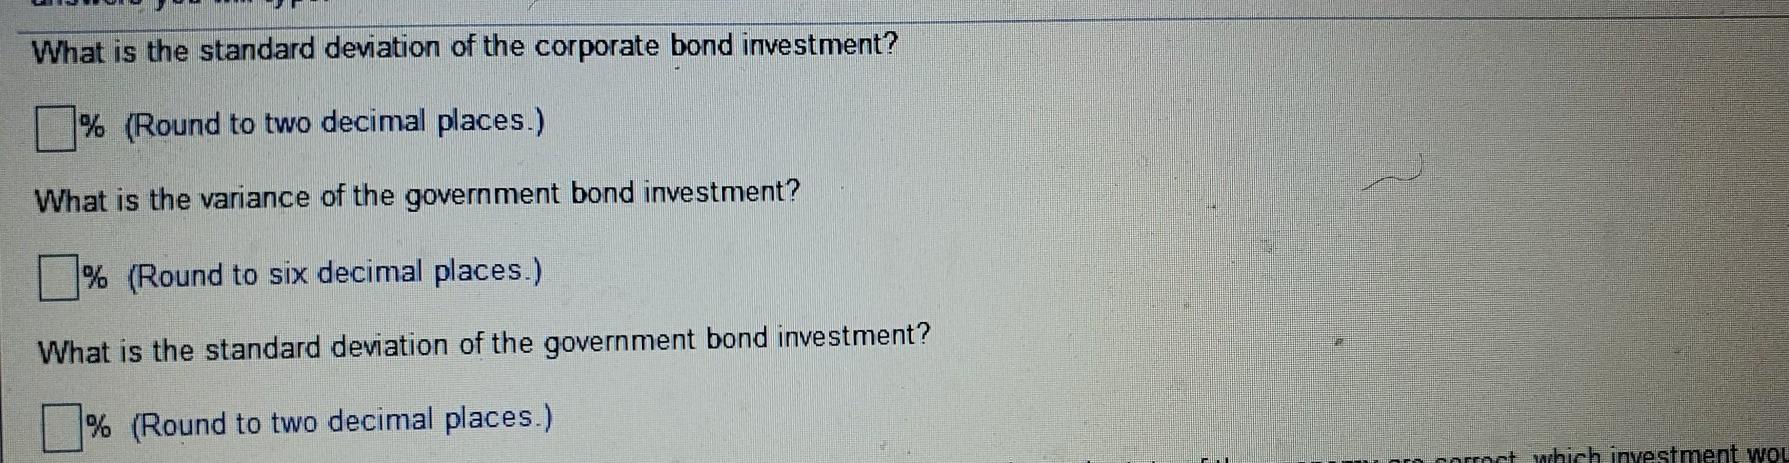
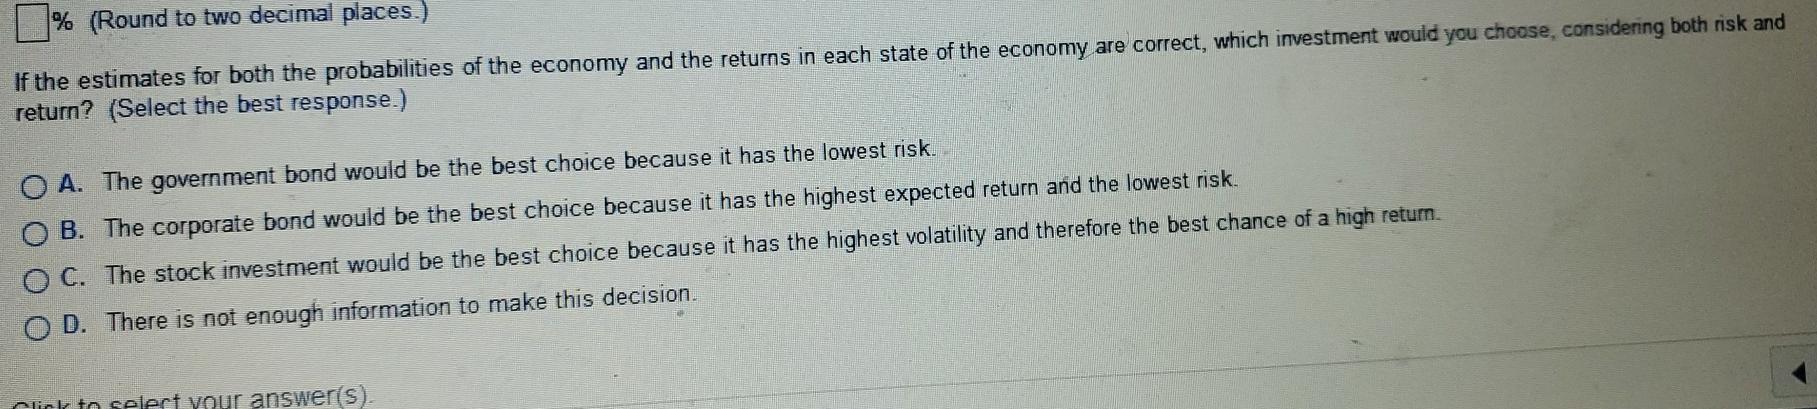
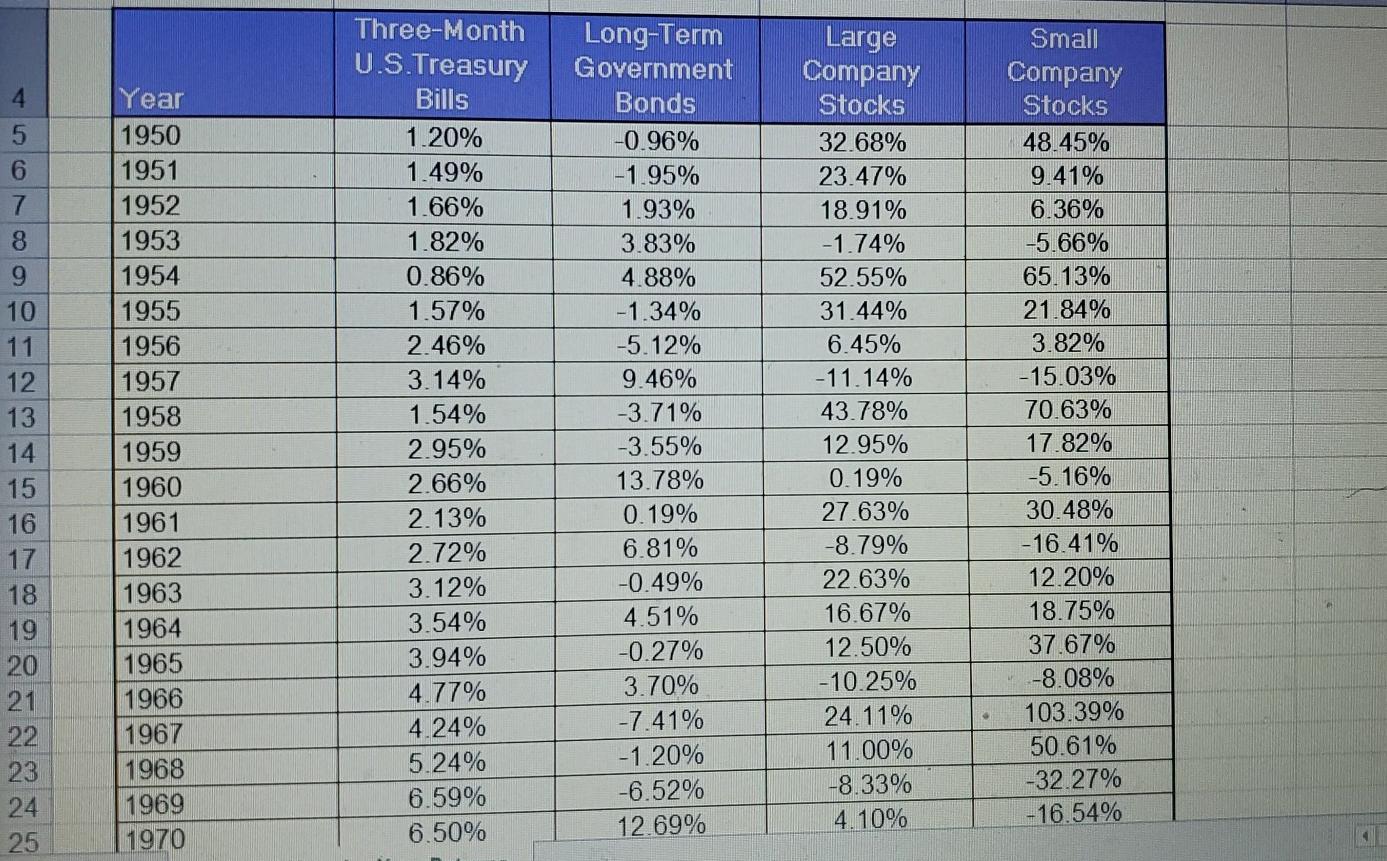
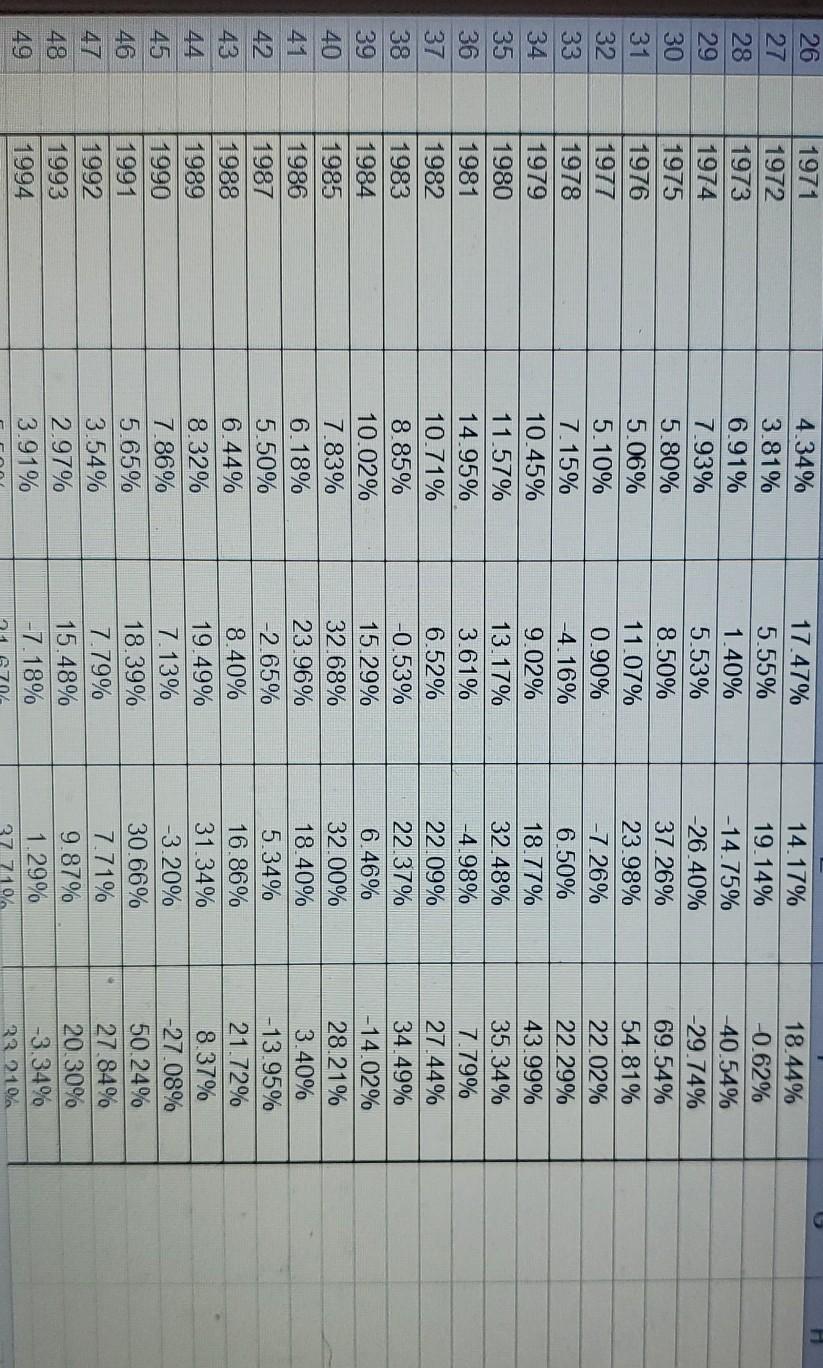
Variance and standard deviation (expected). Hull Consultants, a famous think tank in the Midwest, has provided probability estimates for the four potential economic states for the coming year in the following tables The probability of a boom economy is 12%, the probability of a stable growth economy is 18%, the probability of a stagnant economy is 49%, and the probability of a recession is 21%. Calculate the variance and the standard deviation of the three investments: stock, corporate bond, and government bond. If the estimates for both the probabilities of the economy and the returns in each state of the economy are correct, which investment would you choose, considering both risk and return? Hint: Make sure to round all intermediate calculations to at least seven (7) decimal places. The input instructions, phrases in parenthesis after each answer box, only apply for the answers you will type. What is the variance of the stock investment? % (Round to six decimal places.) What is the standard deviation of the stock investment? % (Round to two decimal places.) What is the variance of the corporate bond investment? % (Round to six decimal places.) What is the standard deviation of the corporate bond investment? % (Round to two decimal places.) If the estimates for both the probabilities of the economy and the returns in each state of the economy are correct, which investment would you choose, considering both risk and return? (Select the best response.) O A. The government bond would be the best choice because it has the lowest risk. O B. The corporate bond would be the best choice because it has the highest expected return and the lowest risk. O C. The stock investment would be the best choice because it has the highest volatility and therefore the best chance of a high return O D. There is not enough information to make this decision. Click to select your answer(s) 4 5 6 7 8 9 10 11 12 13 14 15 16 17 18 19 20 21 22 Year 1950 1951 1952 1953 1954 1955 1956 1957 1958 1959 1960 1961 1962 1963 1964 1965 1966 1967 1968 1969 1970 Three-Month U.S.Treasury Bills 1.20% 1.49% 1.66% 1.82% 0.86% 1.57% 2.46% 3.14% 1.54% 2.95% 2.66% 2.13% 2.72% 3.12% 3.54% 3.94% 4.77% 4.24% 5.24% 6.59% 6.50% Long-Term Government Bonds -0.96% -1.95% 1.93% 3.83% 4.88% -1.34% -5.12% 9.46% -3.71% -3.55% 13.78% 0.19% 6.81% -0.49% 4.51% -0.27% 3.70% -7.41% -1.20% -6.52% 12.69% Large Company Stocks 32.68% 23.47% 18.91% -1.74% 52.55% 31.44% 6.45% -11.14% 43.78% 12.95% 0.19% 27.63% -8.79% 22.63% 16.67% 12.50% -10.25% 24.11% 11.00% -8.33% 4.10% Small Company Stocks 48.45% 9.41% 6.36% -5.66% 65.13% 21.84% 3.82% -15.03% 70.63% 17.82% -5.16% 30.48% -16.41% 12.20% 18.75% 37.67% -8.08% 103.39% 50.61% -32.27% -16.54% 23 24 25 26 27 28 29 30 31 32 33 34 35 36 37 38 39 40 41 42 43 44 1971 1972 1973 1974 1975 1976 1977 1978 1979 1980 1981 1982 1983 1984 1985 1986 1987 1988 1989 1990 1991 1992 1993 1994 4.34% 3.81% 6.91% 7.93% 5.80% 5.06% 5.10% 7.15% 10.45% 11.57% 14.95% 10.71% 8.85% 10.02% 7.83% 6.18% 5.50% 6.44% 8.32% 7.86% 5.65% 3.54% 2.97% 3.91% 17.47% 5.55% 1.40% 5.53% 8.50% 11.07% 0.90% -4.16% 9.02% 13.17% 3.61% 6.52% -0.53% 15.29% 32.68% 23.96% -2.65% 8.40% 19.49% 7.13% 18.39% 7.79% 15.48% -7.18% 14.17% 19.14% -14.75% -26.40% 37.26% 23.98% -7.26% 6.50% 18.77% 32.48% -4.98% 22.09% 22.37% 6.46% 32.00% 18.40% 5.34% 16.86% 31.34% -3.20% 30.66% 7.71% 9.87% 1.29% 37 71 18.44% -0.62% -40.54% -29.74% 69.54% 54.81% 22.02% 22.29% 43.99% 35.34% 7.79% 27.44% 34.49% -14.02% 28.21% 3.40% -13.95% 21.72% 8.37% -27.08% 50.24% 27.84% 20.30% -3.34% 2010 45 46 47 48 49 Variance and standard deviation (expected). Hull Consultants, a famous think tank in the Midwest, has provided probability estimates for the four potential economic states for the coming year in the following tables The probability of a boom economy is 12%, the probability of a stable growth economy is 18%, the probability of a stagnant economy is 49%, and the probability of a recession is 21%. Calculate the variance and the standard deviation of the three investments: stock, corporate bond, and government bond. If the estimates for both the probabilities of the economy and the returns in each state of the economy are correct, which investment would you choose, considering both risk and return? Hint: Make sure to round all intermediate calculations to at least seven (7) decimal places. The input instructions, phrases in parenthesis after each answer box, only apply for the answers you will type. What is the variance of the stock investment? % (Round to six decimal places.) What is the standard deviation of the stock investment? % (Round to two decimal places.) What is the variance of the corporate bond investment? % (Round to six decimal places.) What is the standard deviation of the corporate bond investment? % (Round to two decimal places.) If the estimates for both the probabilities of the economy and the returns in each state of the economy are correct, which investment would you choose, considering both risk and return? (Select the best response.) O A. The government bond would be the best choice because it has the lowest risk. O B. The corporate bond would be the best choice because it has the highest expected return and the lowest risk. O C. The stock investment would be the best choice because it has the highest volatility and therefore the best chance of a high return O D. There is not enough information to make this decision. Click to select your answer(s) 4 5 6 7 8 9 10 11 12 13 14 15 16 17 18 19 20 21 22 Year 1950 1951 1952 1953 1954 1955 1956 1957 1958 1959 1960 1961 1962 1963 1964 1965 1966 1967 1968 1969 1970 Three-Month U.S.Treasury Bills 1.20% 1.49% 1.66% 1.82% 0.86% 1.57% 2.46% 3.14% 1.54% 2.95% 2.66% 2.13% 2.72% 3.12% 3.54% 3.94% 4.77% 4.24% 5.24% 6.59% 6.50% Long-Term Government Bonds -0.96% -1.95% 1.93% 3.83% 4.88% -1.34% -5.12% 9.46% -3.71% -3.55% 13.78% 0.19% 6.81% -0.49% 4.51% -0.27% 3.70% -7.41% -1.20% -6.52% 12.69% Large Company Stocks 32.68% 23.47% 18.91% -1.74% 52.55% 31.44% 6.45% -11.14% 43.78% 12.95% 0.19% 27.63% -8.79% 22.63% 16.67% 12.50% -10.25% 24.11% 11.00% -8.33% 4.10% Small Company Stocks 48.45% 9.41% 6.36% -5.66% 65.13% 21.84% 3.82% -15.03% 70.63% 17.82% -5.16% 30.48% -16.41% 12.20% 18.75% 37.67% -8.08% 103.39% 50.61% -32.27% -16.54% 23 24 25 26 27 28 29 30 31 32 33 34 35 36 37 38 39 40 41 42 43 44 1971 1972 1973 1974 1975 1976 1977 1978 1979 1980 1981 1982 1983 1984 1985 1986 1987 1988 1989 1990 1991 1992 1993 1994 4.34% 3.81% 6.91% 7.93% 5.80% 5.06% 5.10% 7.15% 10.45% 11.57% 14.95% 10.71% 8.85% 10.02% 7.83% 6.18% 5.50% 6.44% 8.32% 7.86% 5.65% 3.54% 2.97% 3.91% 17.47% 5.55% 1.40% 5.53% 8.50% 11.07% 0.90% -4.16% 9.02% 13.17% 3.61% 6.52% -0.53% 15.29% 32.68% 23.96% -2.65% 8.40% 19.49% 7.13% 18.39% 7.79% 15.48% -7.18% 14.17% 19.14% -14.75% -26.40% 37.26% 23.98% -7.26% 6.50% 18.77% 32.48% -4.98% 22.09% 22.37% 6.46% 32.00% 18.40% 5.34% 16.86% 31.34% -3.20% 30.66% 7.71% 9.87% 1.29% 37 71 18.44% -0.62% -40.54% -29.74% 69.54% 54.81% 22.02% 22.29% 43.99% 35.34% 7.79% 27.44% 34.49% -14.02% 28.21% 3.40% -13.95% 21.72% 8.37% -27.08% 50.24% 27.84% 20.30% -3.34% 2010 45 46 47 48 49
Step by Step Solution
There are 3 Steps involved in it

Get step-by-step solutions from verified subject matter experts