

Question: View the raw data table given below for this study. The raw data is only given to you so that you can understand the methodology
View the raw data table given below for this study. The raw data is only given to you so that you can understand the methodology more clearly, View the SPSS data analysis for this study.This is the information you will need to write the results of this study, include a graph of the results.
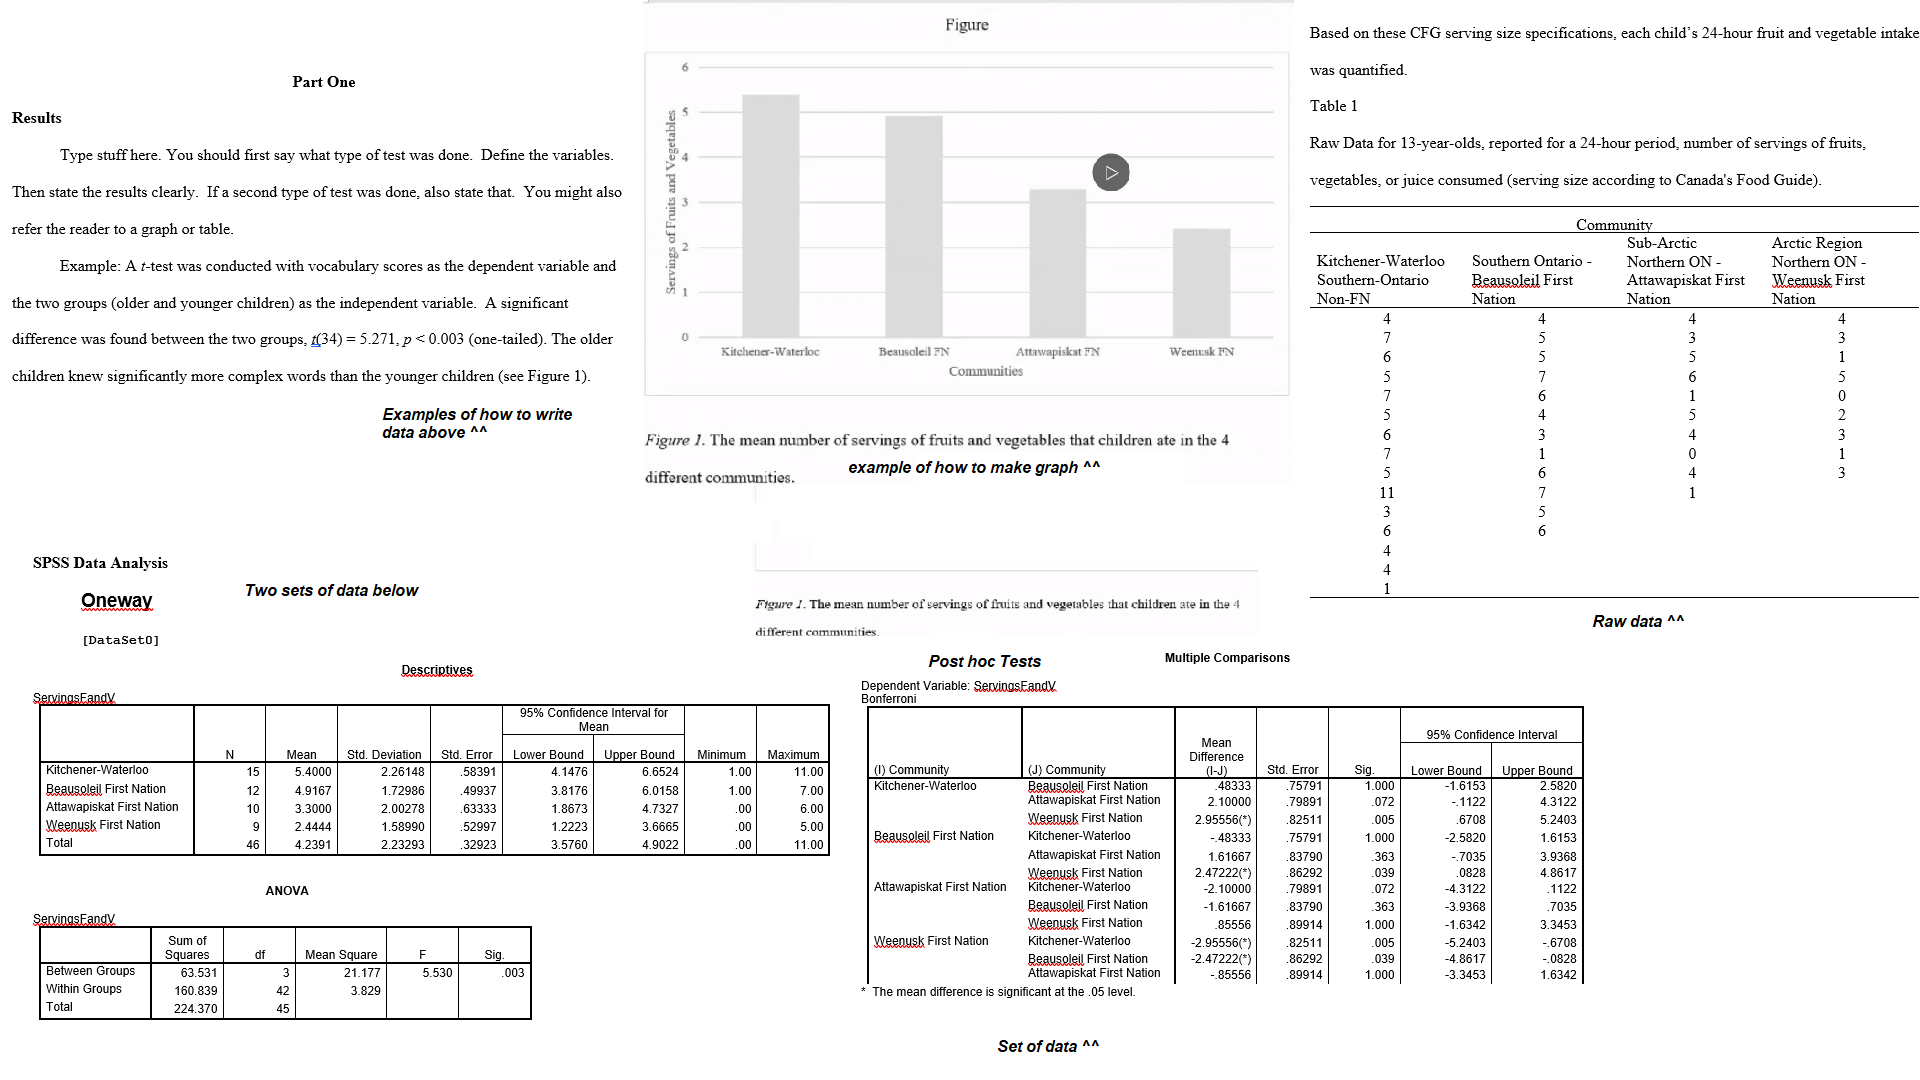
Figure Based on these CFG serving size specifications, each child's 24-hour fruit and vegetable intake Part One was quantified. Results Servings of Fruits and Vegetables Table 1 Type stuff here. You should first say what type of test was done. Define the variables. Raw Data for 13-year-olds, reported for a 24-hour period, number of servings of fruits, D Then state the results clearly. If a second type of test was done, also state that. You might also vegetables, or juice consumed (serving size according to Canada's Food Guide). refer the reader to a graph or table. Community Sub-Arctic Arctic Region Example: A t-test was conducted with vocabulary scores as the dependent variable and Kitchener-Waterloo Southern Ontario - Northern ON - Northern ON - Southern-Ontario Beausoleil First Attawapiskat First Weenusk First the two groups (older and younger children) as the independent variable. A significant Non-FN Nation Nation Nation difference was found between the two groups. [(34) = 5.271, p
Step by Step Solution
There are 3 Steps involved in it

Get step-by-step solutions from verified subject matter experts