

Question: Visualizing a Normal Distribution Given the following score distributions of students in a mathematical quiz. Sketch the graph of the frequency polygon of each distribution.
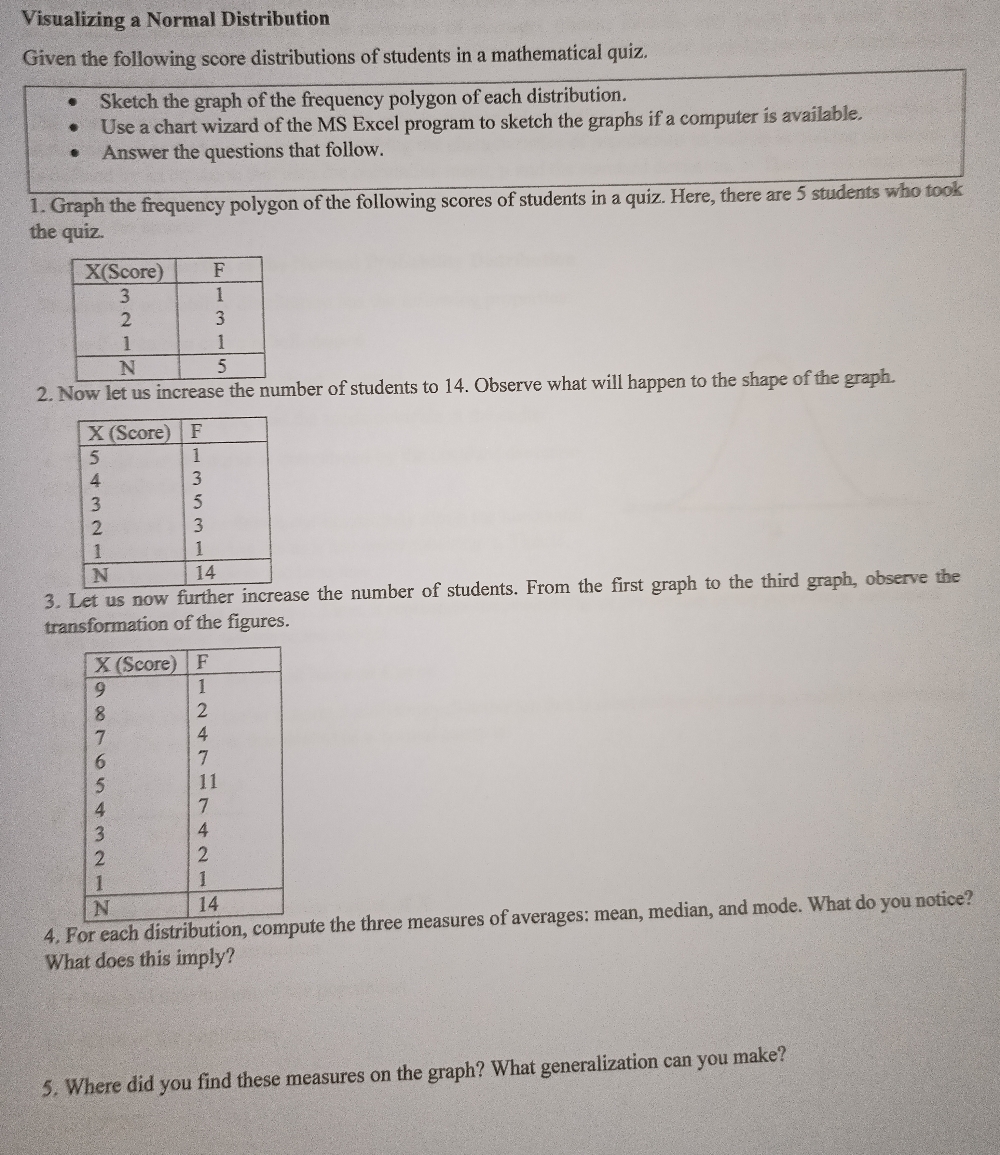

Visualizing a Normal Distribution Given the following score distributions of students in a mathematical quiz. Sketch the graph of the frequency polygon of each distribution. Use a chart wizard of the MS Excel program to sketch the graphs if a computer is available. Answer the questions that follow. 1. Graph the frequency polygon of the following scores of students in a quiz. Here, there are 5 students who took the quiz. X(Score) F 5 2. Now let us increase the number of students to 14. Observe what will happen to the shape of the graph. X (Score) F HNWAU N 14 3. Let us now further increase the number of students. From the first graph to the third graph, observe the transformation of the figures. X (Score) F N 14 4. For each distribution, compute the three measures of averages: mean, median, and mode. What do you notice? What does this imply? 5. Where did you find these measures on the graph? What generalization can you make
Step by Step Solution
There are 3 Steps involved in it

Get step-by-step solutions from verified subject matter experts