

Question: WaterLevel.mat In task c) you need to write MATLAB code for a minimum of 2 of the conditions (you can pick). If you would like
WaterLevel.mat
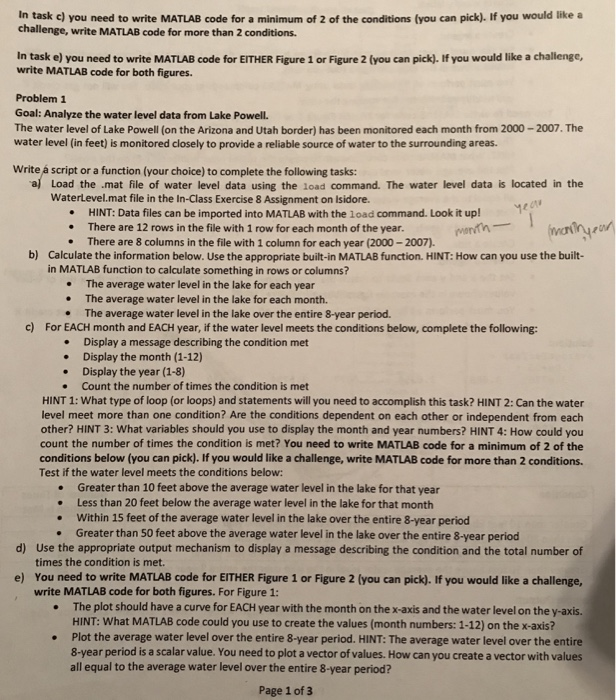
In task c) you need to write MATLAB code for a minimum of 2 of the conditions (you can pick). If you would like challenge, write MATLAB code for more than 2 conditions. In task e) you need to write MATLAB code for EITHER Figure 1 or Figure 2 (you can pick). If you would like a challenge, write MATLAB code for both figures. Problem 1 Goal: Analyze the water level data from Lake Powell. The water level of Lake Powell (on the Arizona and Utah border) has been monitored each month from 2000-2007. The water level (in feet) is monitored closely to provide a reliable source of water to the surrounding areas. Write script or a function (your choice) to complete the following tasks a Load the mat file of water level data using the load command. The water level data is located in the WaterLevel.mat file in the In-Class Exercise 8 Assignment on Isidore. HINT: Data files can be imported into MATLAB with the load command. Look it up! . There are 12 rows in the file with 1 row for each month of the year. There are 8 columns in the file with 1 column for each year (2000-2007). b) Calculate the information below. Use the appropriate built-in MATLAB function. HINT: How can you use the built- in MATLAB function to calculate something in rows or columns? . . e The average water level in the lake for each year The average water level in the lake for each month. The average water level in the lake over the entire 8-year period. c) For EACH month and EACH year, if the water level meets the conditions below, complete the following: Display a message describing the condition met Display the month (1-12) Display the year (1-8) Count the number of times the condition is met e . HINT 1: What type of loop (or loops) and statements will you need to accomplish this task? HINT 2: Can the water level meet more than one condition? Are the conditions dependent on each other or independent from each other? HINT 3: What variables should you use to display the month and year numbers? HINT 4: How could you count the number of times the condition is met? You need to write MATLAB code for a minimum of 2 of the conditions below (you can pick). If you would like a challenge, write MATLAB code for more than 2 conditions Test if the water level meets the conditions below: Greater than 10 feet above the average water level in the lake for that year Less than 20 feet below the average water level in the lake for that month Within 15 feet of the average water level in the lake over the entire 8-year period Greater than 50 feet above the average water level in the lake over the entire 8-year period . Use the appropriate output mechanism to display a message describing the condition and the total number of times the condition is met You need to write MATLAB code for EITHER Figure 1 or Figure 2 (you can pick). If you would like a challenge, write MATLAB code for both figures. For Figure 1: d) e) The plot should have a curve for EACH year with the month on the x-axis and the water level on the y-axis. HINT: What MATLAB code could you use to create the values (month numbers: 1-12) on the x-axis? Plot the average water level over the entire 8-year period. HINT: The average water level over the entire 8-year period is a scalar value. You need to plot a vector of values. How can you create a vector with valu all equal to the average water level over the entire 8-year period? Page 1 of 3
Step by Step Solution
There are 3 Steps involved in it

Get step-by-step solutions from verified subject matter experts