

Question: We are using Loop-Pro software for the simulations and data. Please help with all parts, Thanks! is expected to remain constant for extended periods of
 We are using Loop-Pro software for the simulations and data. Please help with all parts, Thanks!
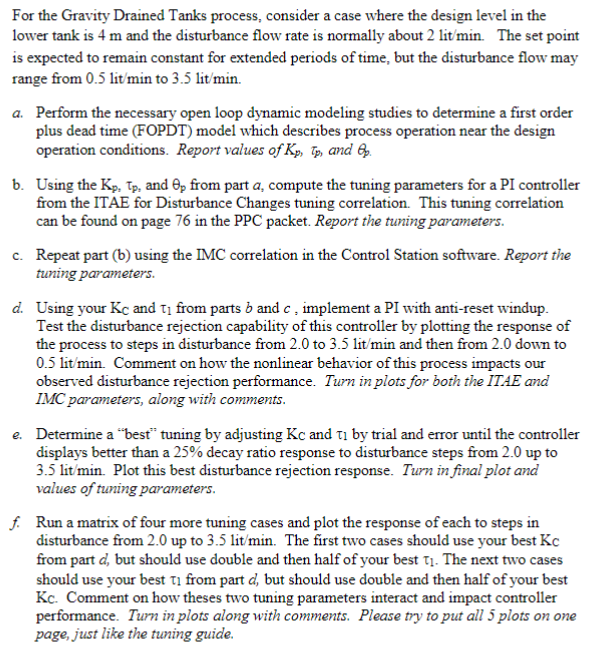
is expected to remain constant for extended periods of time, but the disturbance flow may range from 0.5lit/min to 3.5lit/min. a. Perform the necessary open loop dynamic modeling studies to determine a first order plus dead time (FOPDT) model which describes process operation near the design operation conditions. Report values of Kp,p, and p. b. Using the Kp,p, and p from part a, compute the tuning parameters for a PI controller from the ITAE for Disturbance Changes tuning correlation. This tuning correlation can be found on page 76 in the PPC packet. Report the tuning parameters. c. Repeat part (b) using the IMC correlation in the Control Station software. Report the tuning parameters. d. Using your KC and 1 from parts b and c, implement a PI with anti-reset windup. Test the disturbance rejection capability of this controller by plotting the response of the process to steps in disturbance from 2.0 to 3.5lit/min and then from 2.0 down to 0.5lit/min. Comment on how the nonlinear behavior of this process impacts our observed disturbance rejection performance. Turn in plots for both the ITAE and IMC parameters, along with comments. e. Determine a "best" tuning by adjusting KC and 1 by trial and error until the controller displays better than a 25% decay ratio response to disturbance steps from 2.0 up to 3.5 lit/min. Plot this best disturbance rejection response. Turn in final plot and values of tuning parameters. f. Run a matrix of four more tuning cases and plot the response of each to steps in disturbance from 2.0 up to 3.5lit/min. The first two cases should use your best KC from part d, but should use double and then half of your best 1. The next two cases should use your best 1 from part d, but should use double and then half of your best K. Comment on how theses two tuning parameters interact and impact controller performance. Turn in plots along with comments. Please try to put all 5 plots on one page, just like the tuning guide
Step by Step Solution
There are 3 Steps involved in it

Get step-by-step solutions from verified subject matter experts